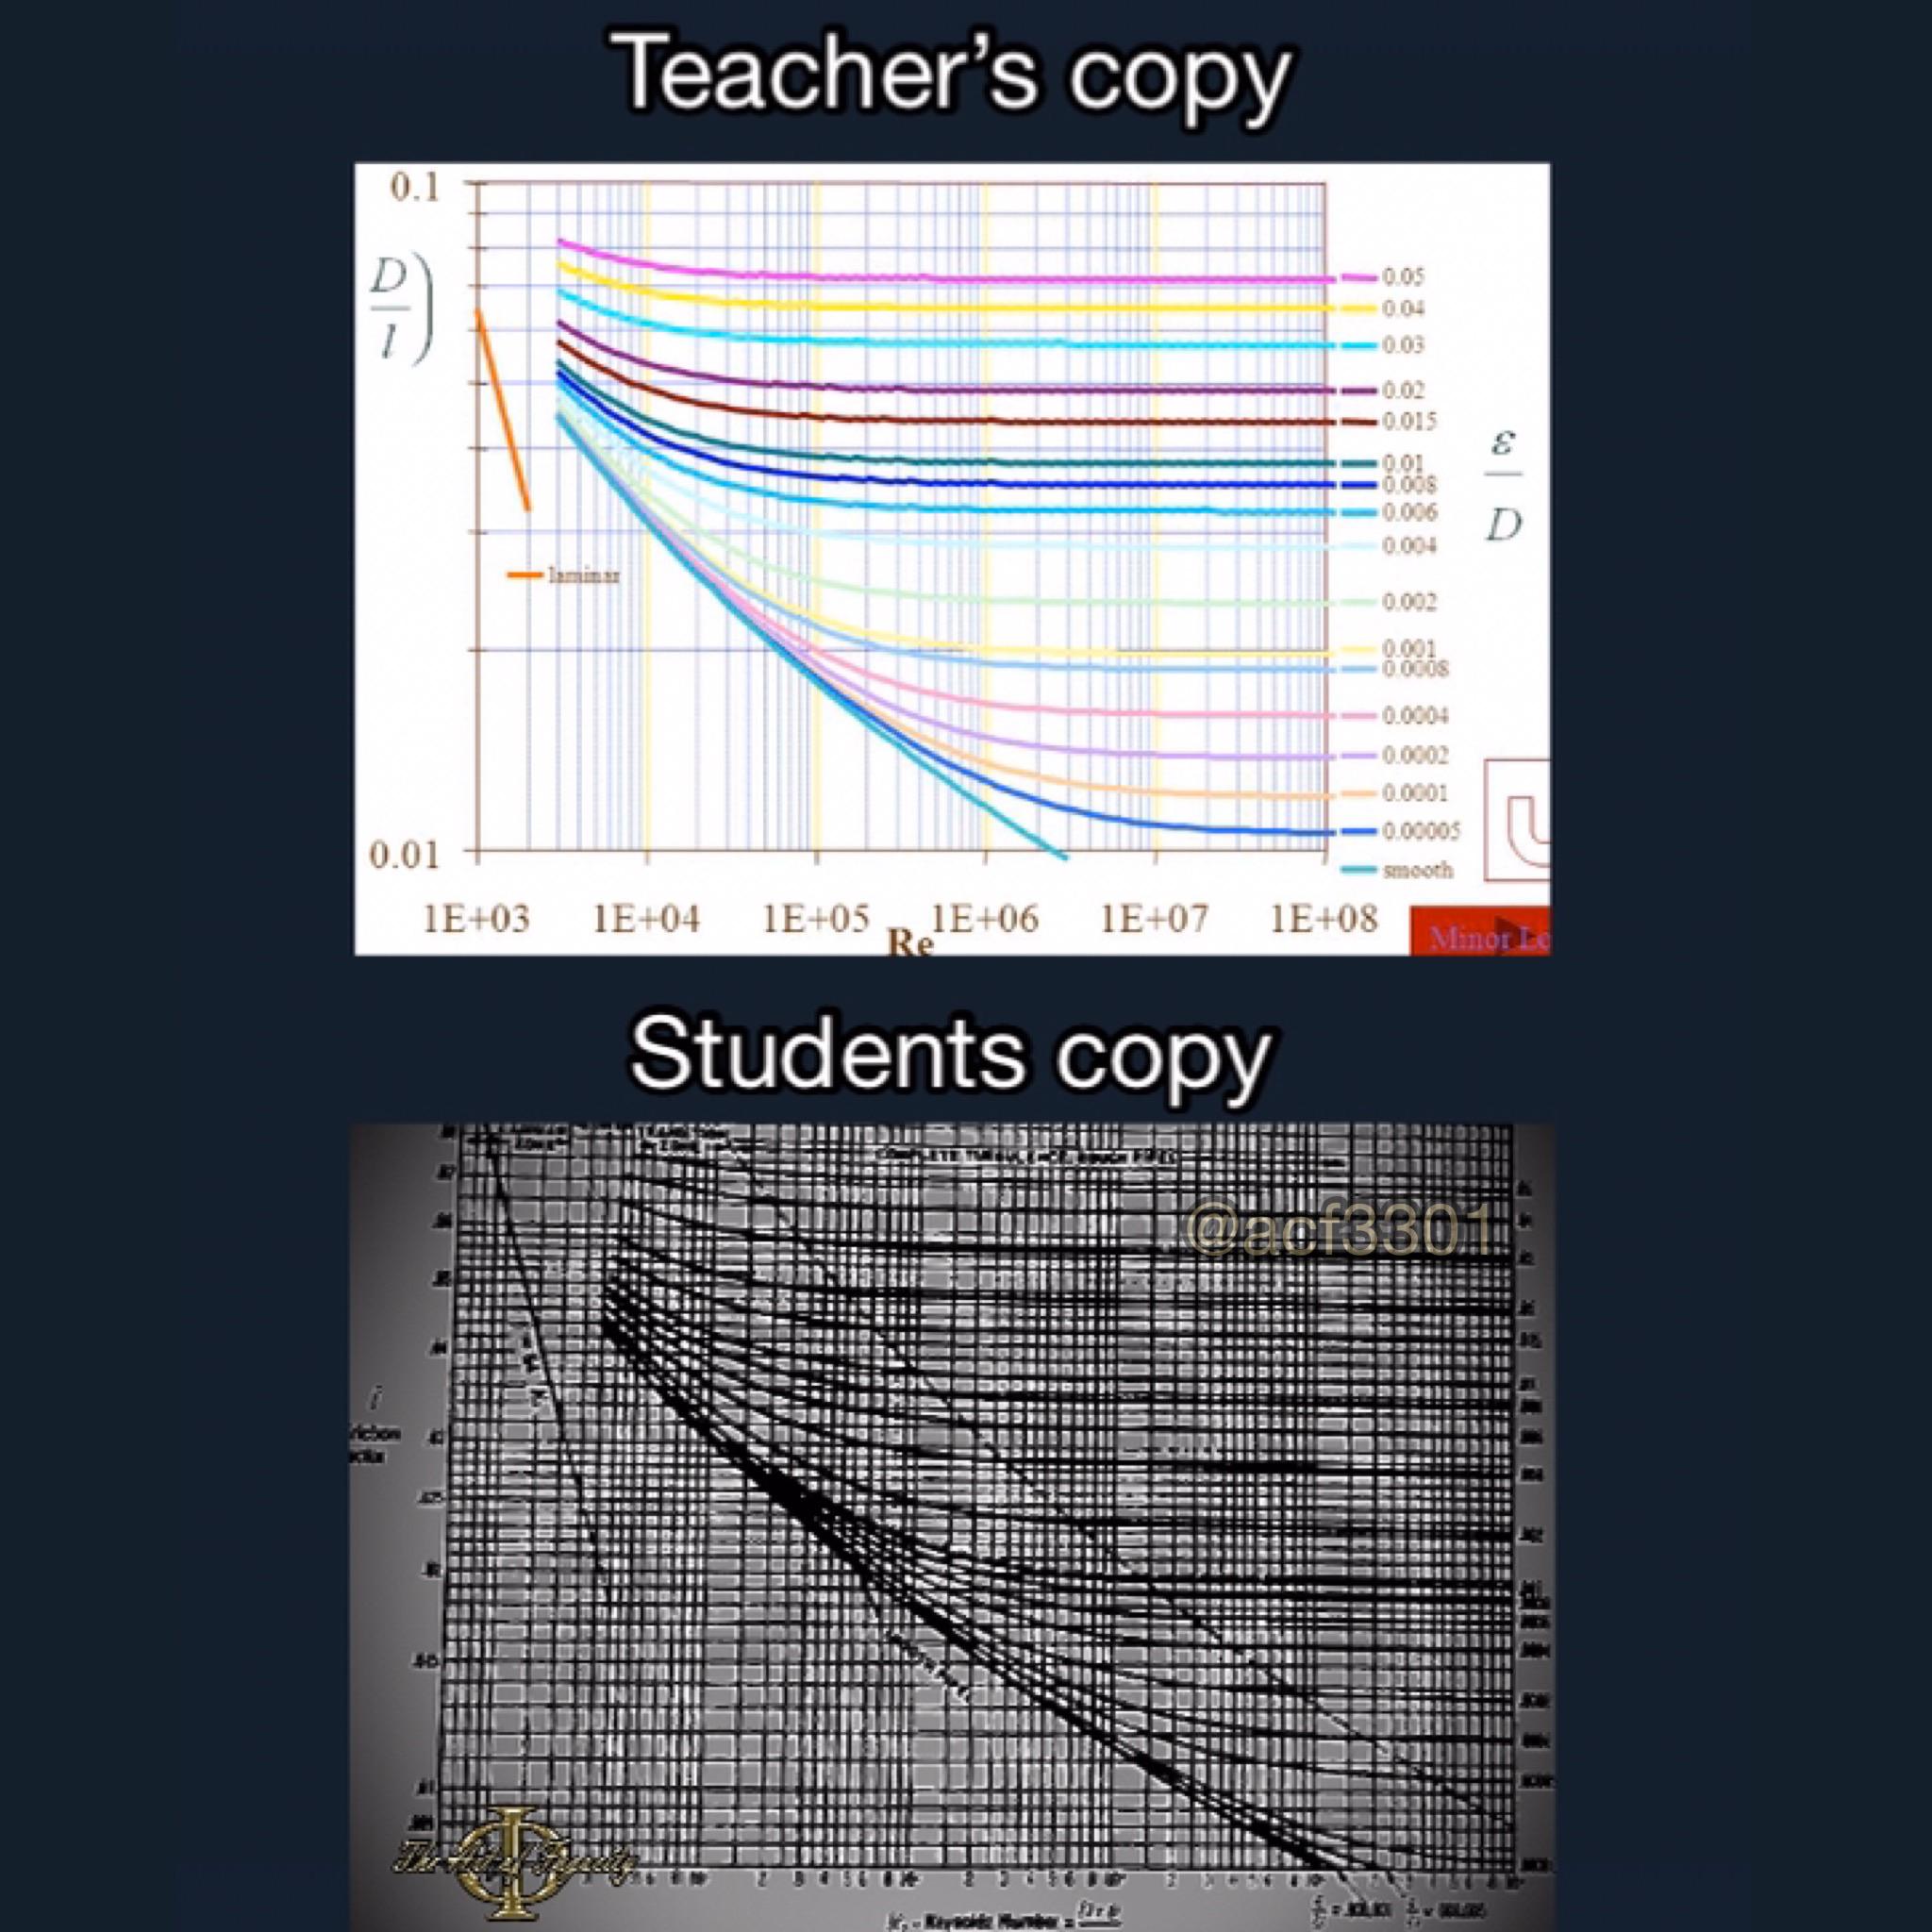
Ever notice how textbook diagrams undergo a mysterious transformation when copied to the blackboard? The teacher's version shows a beautiful, colorful Moody diagram with perfectly labeled Reynolds numbers and friction factors. Then there's what students actually get—a cryptic grid with what appears to be the EKG of a dying calculator.
Engineering students know the pain. "Here's a simple diagram that explains fluid dynamics," says the professor, before proceeding to draw something that looks like a drunk spider crawled through ink. And somehow we're expected to use this to design actual bridges and rockets. No pressure!

 Academia
 Ai
Ai
 Astronomy
 Biology
 Chemistry
 Climate
 Conspiracy
 Earth-science
 Engineering
 Evolution
 Geology


