 Academia
 Ai
Ai
 Astronomy
 Biology
 Chemistry
 Climate
 Conspiracy
 Earth-science
 Engineering
 Evolution
 Geology
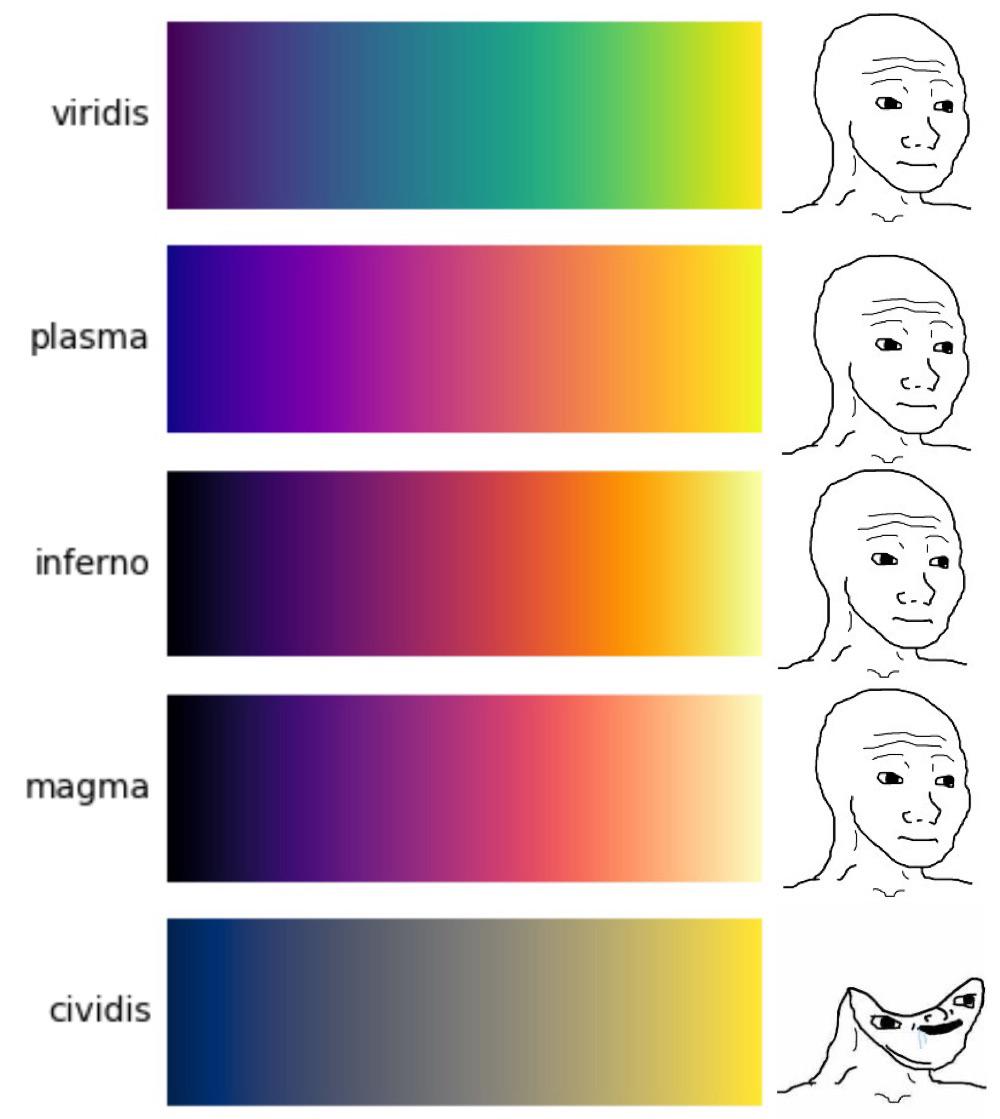
The scientific community's collective existential crisis over color map choices in data visualization. Four perfectly reasonable gradient options (viridis, plasma, inferno, magma) elicit mild confusion, but "cividis" — that slight blue-yellow abomination — triggers pure scientific rage. Nothing exposes a researcher's primal instincts like a poorly chosen color gradient that makes your retinas file for divorce. The matplotlib developers knew exactly what they were doing when they created this crime against visual cortices everywhere.
The Colormap That Broke The Scientist
colormap-memes, matplotlib-memes, dataviz-memes, science-memes, programming-memes | ScienceHumor.io
More Like This