Diagrams Memes

Posts tagged with Diagrams

Resistance Is Variable

Resistance Is Variable
The meme brilliantly illustrates the difference between a normal resistor symbol (left) and a potentiometer/variable resistor symbol (right) in circuit diagrams. The confused expression represents every electronics student seeing these symbols for the first time, while the happy face represents the satisfaction when you finally understand the distinction. It's that magical moment when electrical engineering notation suddenly clicks—from "what are these weird zigzags?" to "of course, the diagonal arrow indicates variable resistance!" Only true circuit nerds get excited about proper component notation.

When You're A Math Genius But Graphics-Challenged

When You're A Math Genius But Graphics-Challenged
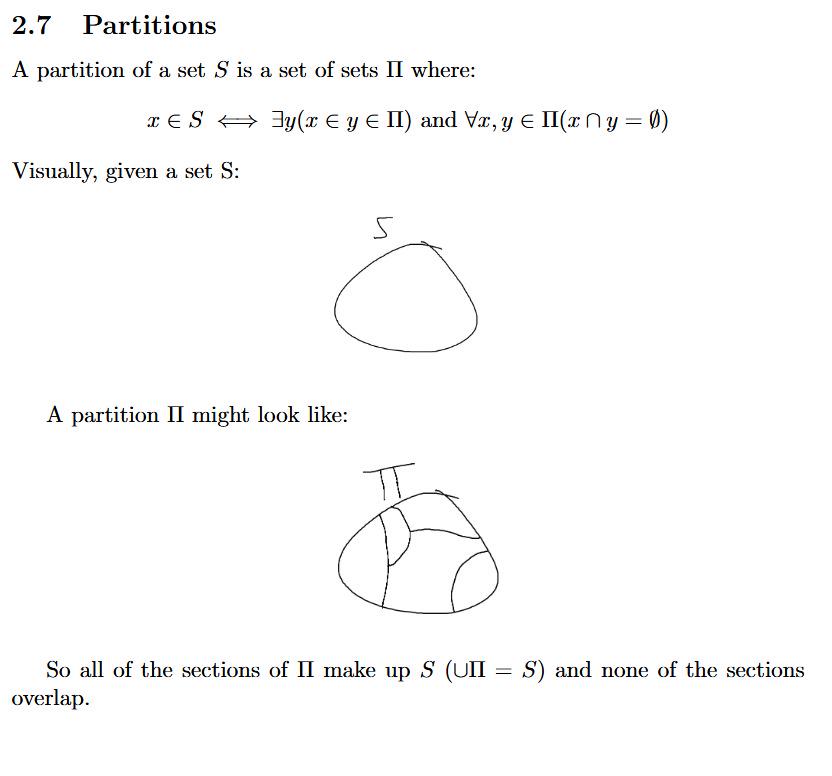
The mathematical equivalent of using a stone axe to build a spaceship! This poor soul is trying to typeset elegant set theory in LaTeX (the gold standard for mathematical documents) but creating their diagrams in MS Paint—the digital equivalent of drawing with crayons. Those wobbly, hand-drawn partition lines are the mathematical equivalent of serving a gourmet meal on a paper plate. The contrast between the formal notation (∀x,y ∈ Π(x ∩ y = ∅)) and those shaky MS Paint curves is pure mathematical blasphemy! It's like watching someone solve differential equations with an abacus. Every mathematician viewing this just felt a disturbance in the force.

Damn Near Ruined My Eyes

Damn Near Ruined My Eyes
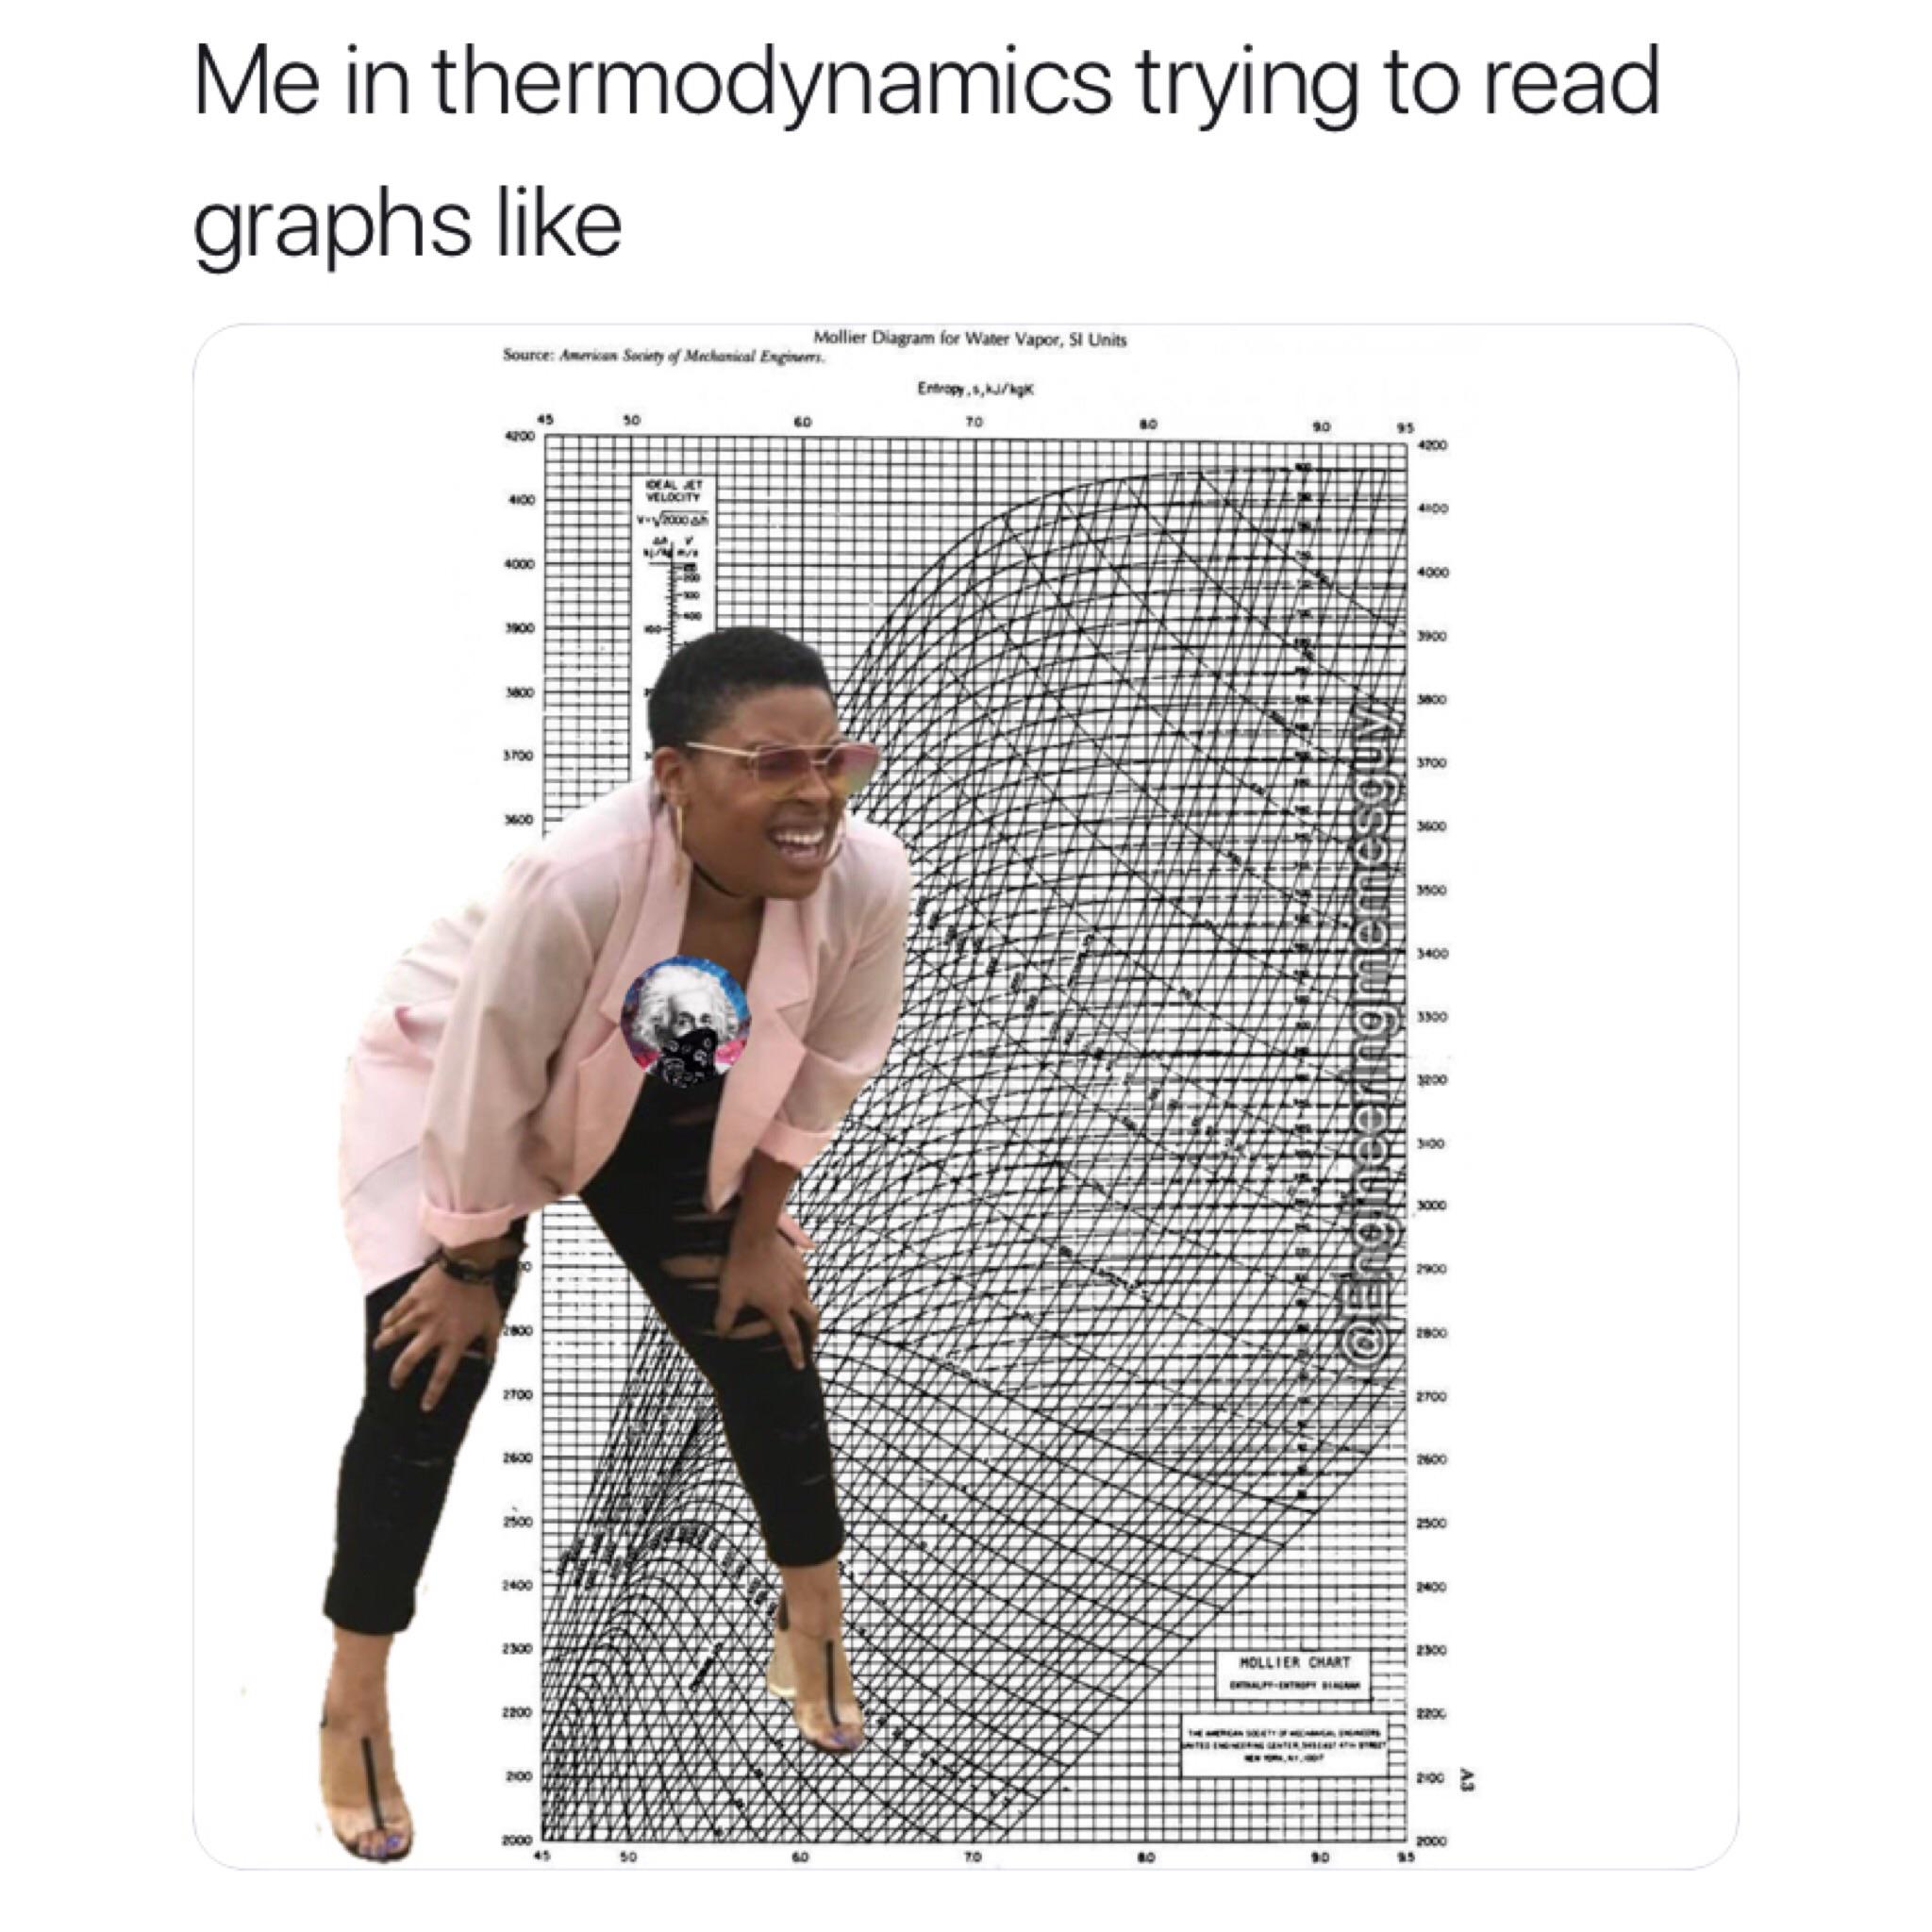
Looking at a Mollier diagram is the engineering equivalent of trying to read a subway map while riding a rollercoaster. That tangle of pressure, enthalpy, and entropy lines isn't just a graph—it's a visual assault weapon. Engineering students squint at these monstrosities trying to figure out if water is vapor, liquid, or possibly transforming into a fifth state of matter nobody's discovered yet. The second law of thermodynamics should've included "thou shalt not create incomprehensible spaghetti diagrams that make students question their career choices." Prescription glasses companies must make a fortune during thermodynamics semester!

I Have Attempted Science

I Have Attempted Science
The scientific method in its purest form! First comes the wild hypothesis, then the crushing realization that reality doesn't care about your brilliant ideas. But the real science happens when you document your wrongness with excessive detail and colorful diagrams! Nothing says "professional researcher" like creating a meticulously crafted presentation about all the ways your theory spectacularly imploded. Graduate students everywhere are feeling personally attacked right now.

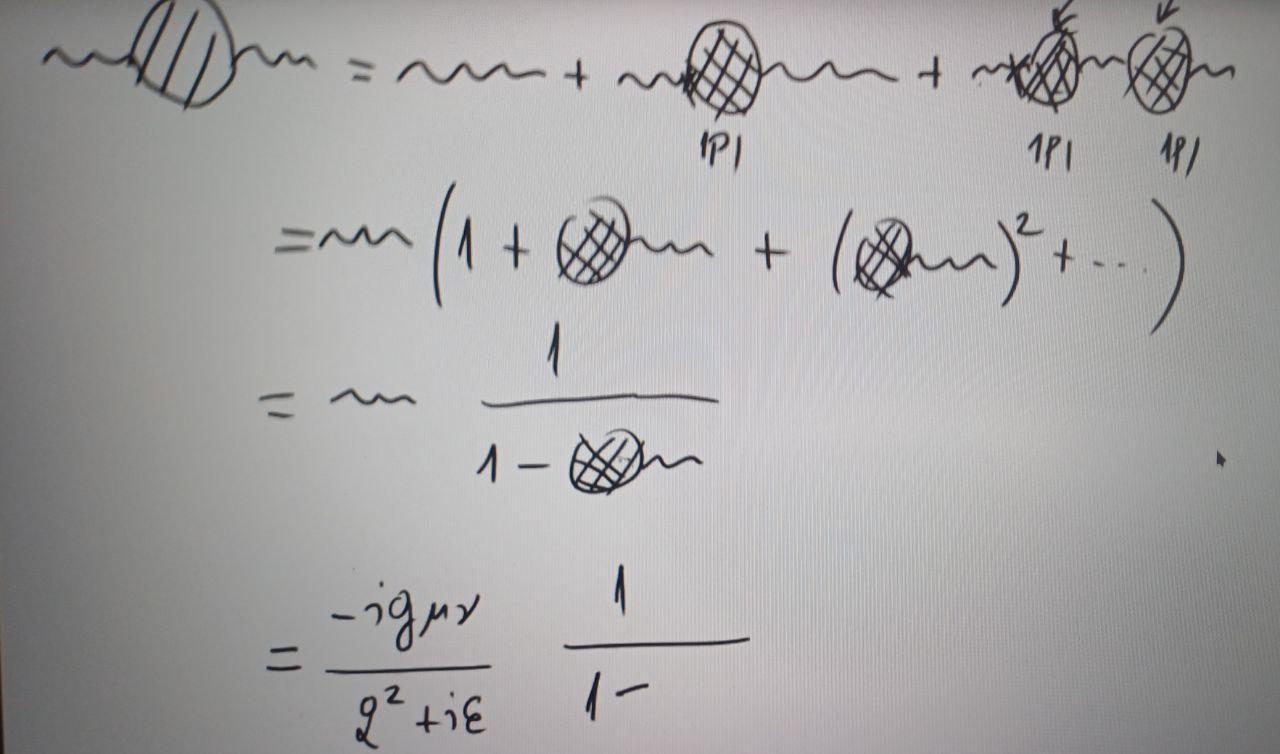
Feynman Diagram >> Writing The Integral Explicitly

Feynman Diagram >> Writing The Integral Explicitly
Classical physicists: "We need exact solutions!" Meanwhile, Richard Feynman's just sitting there like "What if we just... draw some squiggly lines?" The beauty of Feynman diagrams is that they turned horrifyingly complex quantum field theory integrals into cute little pictures that even undergrads can understand (sort of). While traditional mathematicians were having existential crises over unsolvable equations, Feynman was like "hold my bongo drums" and revolutionized physics with doodles. The Nobel committee basically gave him a prize for being the ultimate physics hack artist. And that angry guy in the third panel? That's every mathematician who spent years deriving exact solutions only to be upstaged by some feather diagrams and perturbation theory.