Data analysis Memes

Posts tagged with Data analysis

Years Of Academy Training Wasted

Years Of Academy Training Wasted
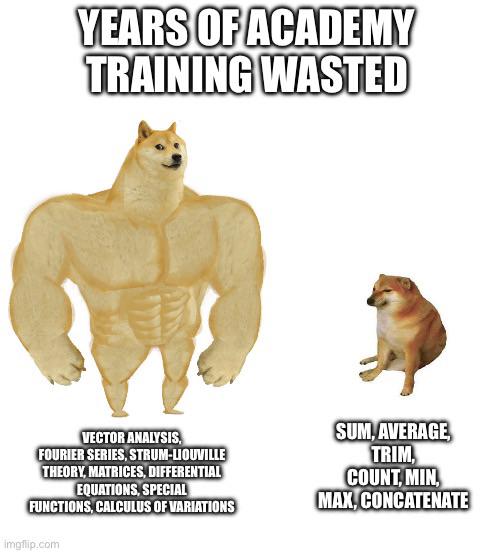
The eternal struggle of academia in one glorious image. On the left, we have Buff Doge representing the complex mathematical artillery you're armed with after years of higher education - vector analysis, Fourier series, and differential equations that could make Einstein sweat. On the right? Regular Doge using Excel functions that any intern could learn in an afternoon. The crushing reality that most "real-world jobs" require about 2% of what you spent a decade mastering. Nothing quite captures the existential crisis of realizing your thesis on Sturm-Liouville theory is less valuable to employers than knowing how to use CONCATENATE. The academic equivalent of training for the Olympics only to end up in a three-legged race.

The Four Horsemen Of Academic Procrastination

The Four Horsemen Of Academic Procrastination
The four horsemen of grad student procrastination: YouTube rabbit holes, rage-quitting video games, wrestling with MATLAB code until 3 AM, and recording yourself explaining concepts you don't understand yet. The research paper deadline approaches while your only accomplishment is perfecting the syntax for a single plot function.

I Should Open A Bakery

I Should Open A Bakery
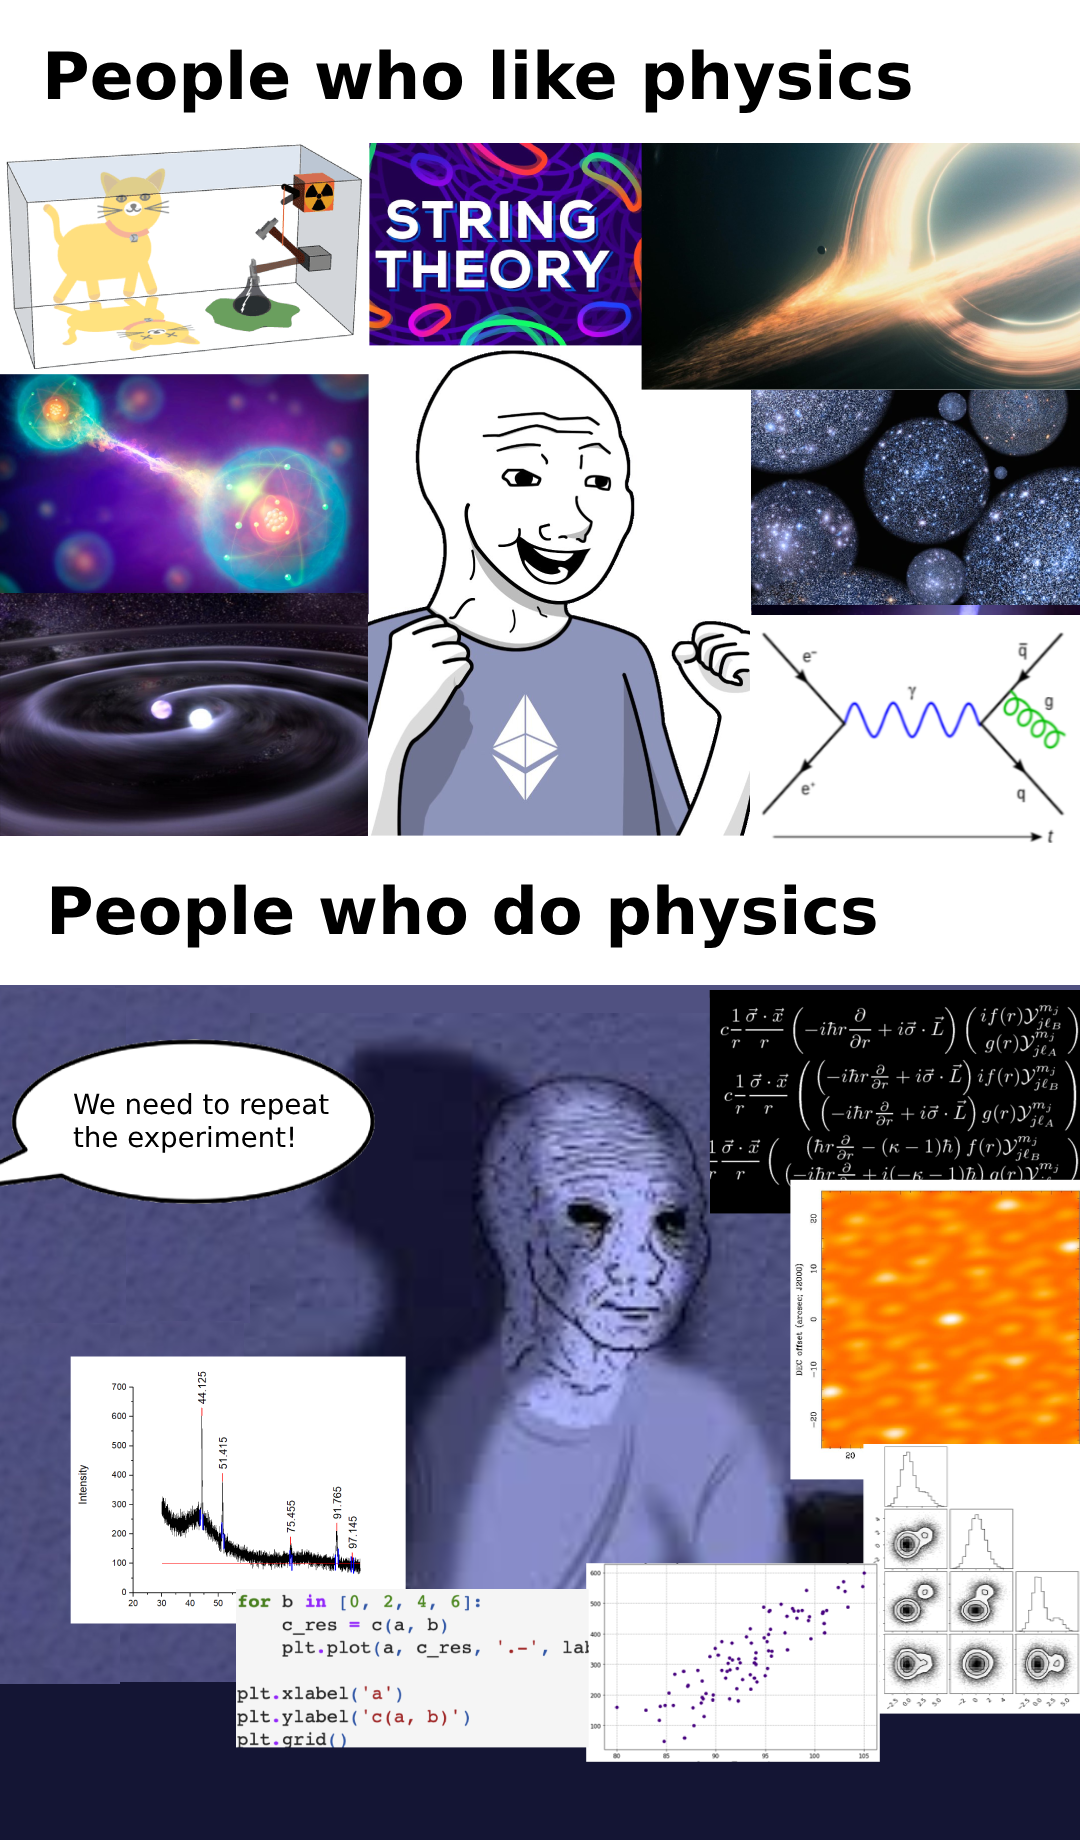
The expectation vs. reality of physics is brutally accurate here! The top shows physics enthusiasts drooling over Schrödinger's cat, black holes, and pretty string theory visualizations. Meanwhile, actual physicists are drowning in complex equations, staring at grainy data plots, and muttering "we need to repeat the experiment" for the 47th time because their results look like static noise. It's the scientific equivalent of seeing a gorgeous cake on Instagram vs. the burnt mess you actually made. Physics from afar: cosmic wonder! Physics up close: debugging Python code at 2 AM while questioning your life choices.

Matlab Never Lets You Down

Matlab Never Lets You Down
Dating confusion? Try MATLAB's Mixed-Signal Analyzer. While your romantic prospects remain ambiguous, at least your frequency domain transformations will be crystal clear. Engineers don't need to decipher human emotions when we can just decompose complex waveforms into their constituent frequencies. The irony that we'd rather spend 6 hours debugging code than 10 minutes interpreting a text message is not lost on us.

Errors Everywhere

Errors Everywhere
The infamous "negligible error" strikes again! The lab manual writers must be living in some parallel universe where statistical fluctuations don't exist. Meanwhile, your data points are scattered across the graph like they're trying to escape the coordinate system entirely. Nothing says "successful experiment" like results that could double as a Jackson Pollock painting. The real experiment is seeing how many error bars you can creatively hide in your lab report before your professor notices!

Critical Exchange

Critical Exchange
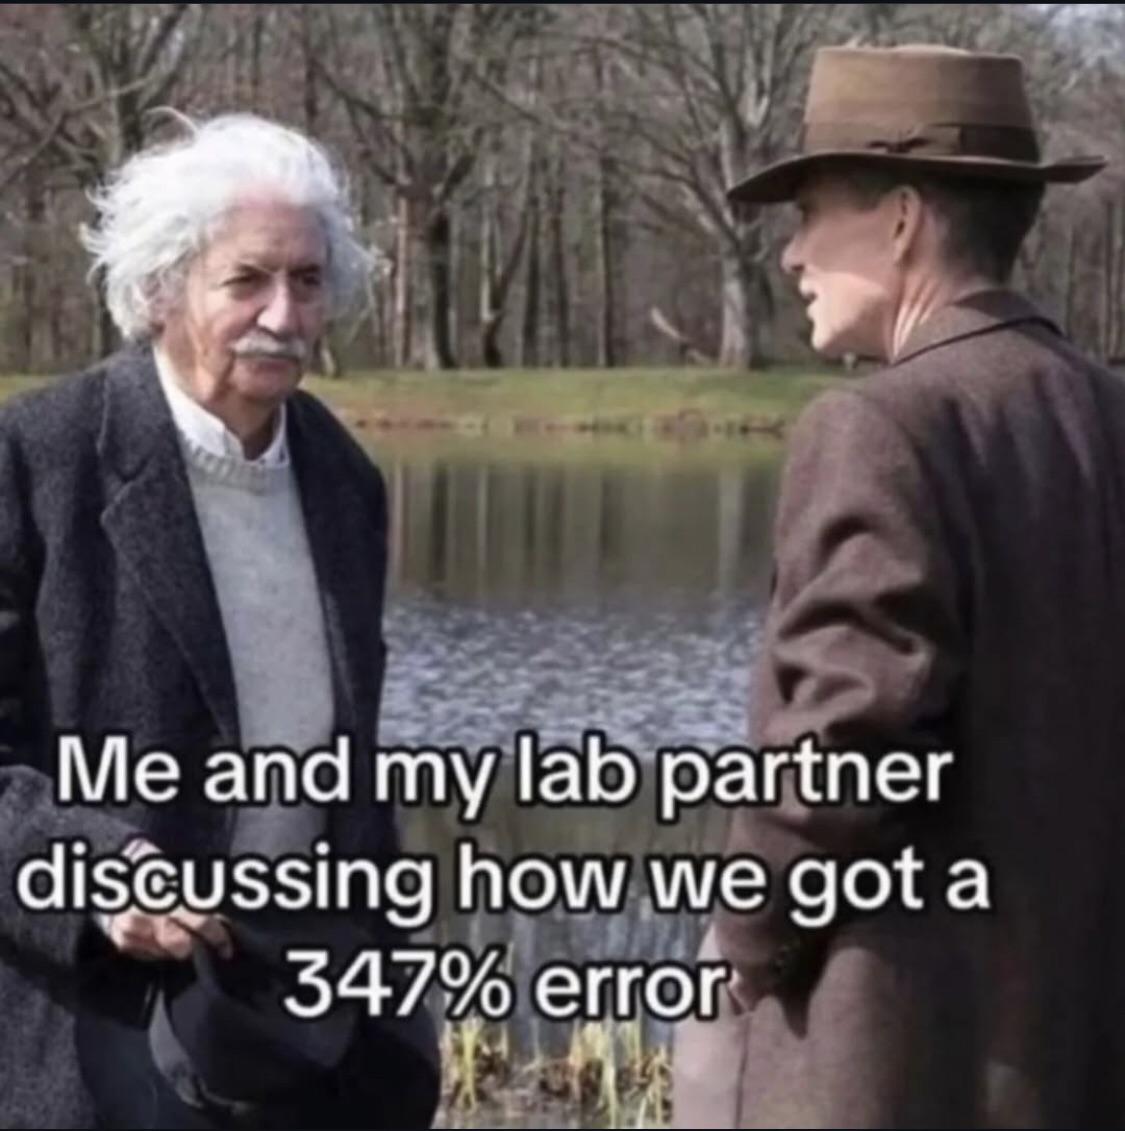
Two researchers having a calm lakeside chat about how they've achieved the scientific equivalent of setting the lab on fire. 347% error isn't just wrong—it's impressively, catastrophically wrong. That's not a margin of error; that's a margin of "perhaps we should consider a career change." The serene natural backdrop really complements the complete statistical disaster they've created. Nothing says "we've transcended conventional failure" like discussing your experimental apocalypse with the tranquility of seasoned scientists who've seen worse... though honestly, they probably haven't.

Bad Dog! Don't Lick The Function!

Bad Dog! Don't Lick The Function!
Nothing ruins a perfectly good 3D function visualization like a curious canine tongue. That colorful mathematical surface isn't a doggy swimming pool - it's someone's PhD thesis getting slobbered on! The "schlop schlop" sound effect really captures that special moment when months of computational work becomes a dog's personal salt lick. Next time you're plotting complex wave functions, maybe invest in a pet gate for your home office. Graduate students everywhere are nodding in silent solidarity.

Nobody Likes To Hear The Truth

Nobody Likes To Hear The Truth
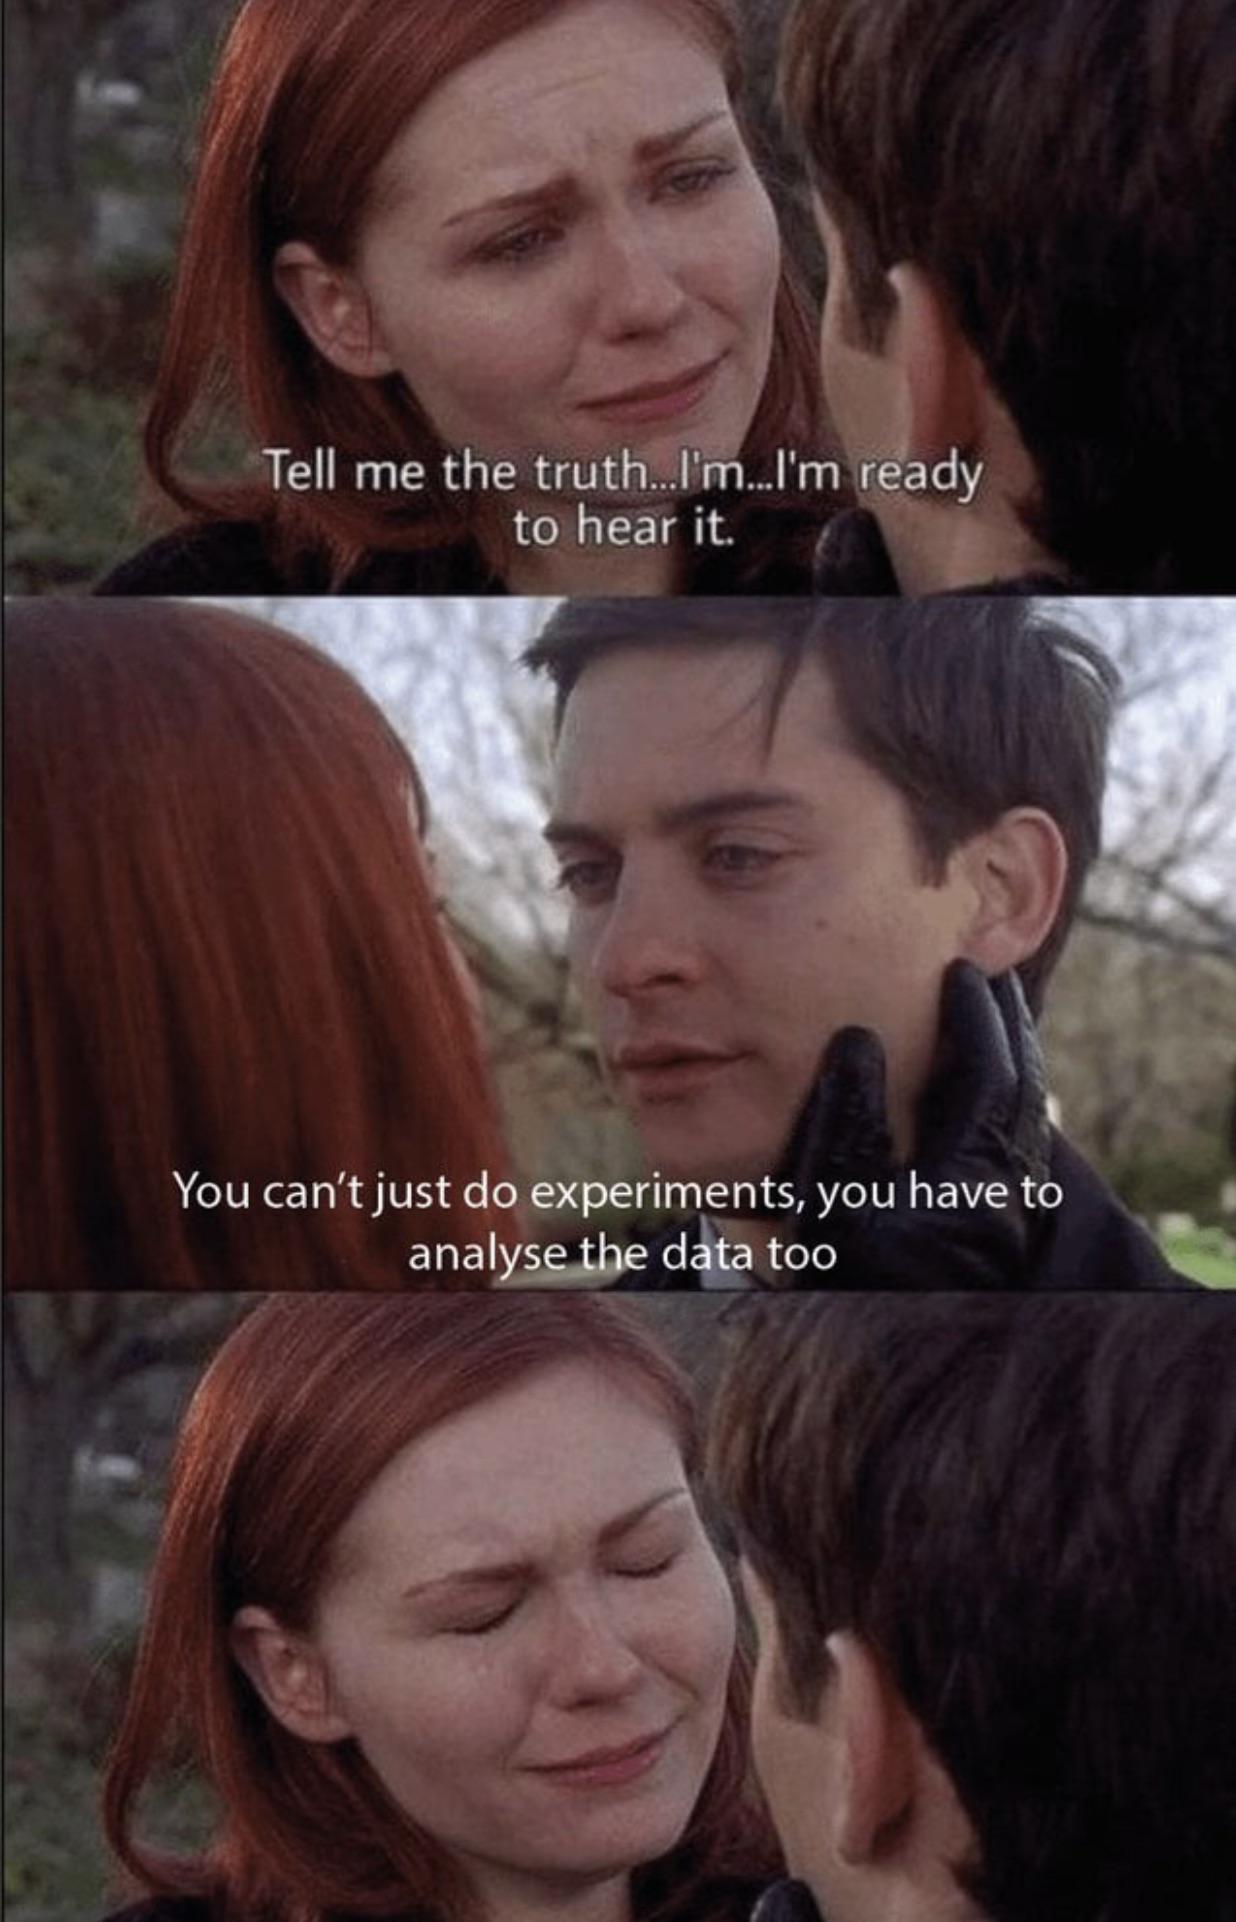
The crushing moment when you realize collecting data was the fun part. The real horror story begins when your advisor drops the bombshell that you need to actually make sense of those 10,000 spreadsheet cells you've been accumulating for months. Data analysis - where dreams of scientific breakthroughs go to die and statisticians go to thrive! That moment of silent weeping is universal across every lab in existence. Remember kids, running experiments is just scientific foreplay - the real commitment is the analysis afterward.

The Statistical Love Triangle

The Statistical Love Triangle
The statistical love triangle we never knew we needed! The guy (labeled "MEAN") is clearly distracted by the attractive "OUTLIER" walking by, while his girlfriend (labeled "MEDIAN") looks on in disbelief. It's the perfect visualization of how these statistical measures behave. The mean is easily influenced by extreme values (hello, outliers!), while the median stays reliably unaffected by such statistical flirtations. Data scientists everywhere are nodding knowingly. This is exactly why we use median home prices instead of mean when that one Beverly Hills mansion would skew the entire neighborhood average!

The Statistical Trauma Transformation

The Statistical Trauma Transformation
The transformation is REAL! Nothing prepares you for the mental gauntlet of serious data analysis. You start all fresh-faced and optimistic, thinking "I'll just run a quick regression!" Then reality hits—outliers everywhere, assumptions violated, and suddenly you're knee-deep in statistical nightmares at 3 AM. Your hairline recedes with each p-value calculation, and that thousand-yard stare develops as you realize your beautiful hypothesis is being murdered by ugly facts. The face on the right is every grad student after discovering their months of work need "just a few minor corrections." Statistical trauma is no joke!

The Analytical Chemistry Conspiracy

The Analytical Chemistry Conspiracy
The analytical chemistry conspiracy has finally been exposed. Those endless hours calibrating instruments? Pure theater. Molecules having feelings beyond "excited" and "relaxed" states? Revolutionary concept. Every analytical chemist nodding solemnly at incomprehensible spectra while thinking "I have no idea what this peak means but I'll die before admitting it." The true mark of expertise: creating equipment acronyms so long they require their own DOI. Next breakthrough paper: "Statistical Analysis Proves 87% of Analytical Chemistry Is Just Guessing Confidently."

I Wanna Make Them Pie Charts Too

I Wanna Make Them Pie Charts Too
Those beautiful data visualizations in scientific papers don't just happen by magic! Behind every stunning pie chart is a scientist who spent 3 hours figuring out why Excel keeps crashing, 2 hours trying to make the colors match, and another hour debating if they should add a shadow effect. The struggle between wanting professional-looking charts and having absolutely zero graphic design skills is the hidden battle of modern research. Data analysis? Easy. Making it look pretty? That's the REAL experiment!