 Academia
 Ai
Ai
 Astronomy
 Biology
 Chemistry
 Climate
 Conspiracy
 Earth-science
 Engineering
 Evolution
 Geology
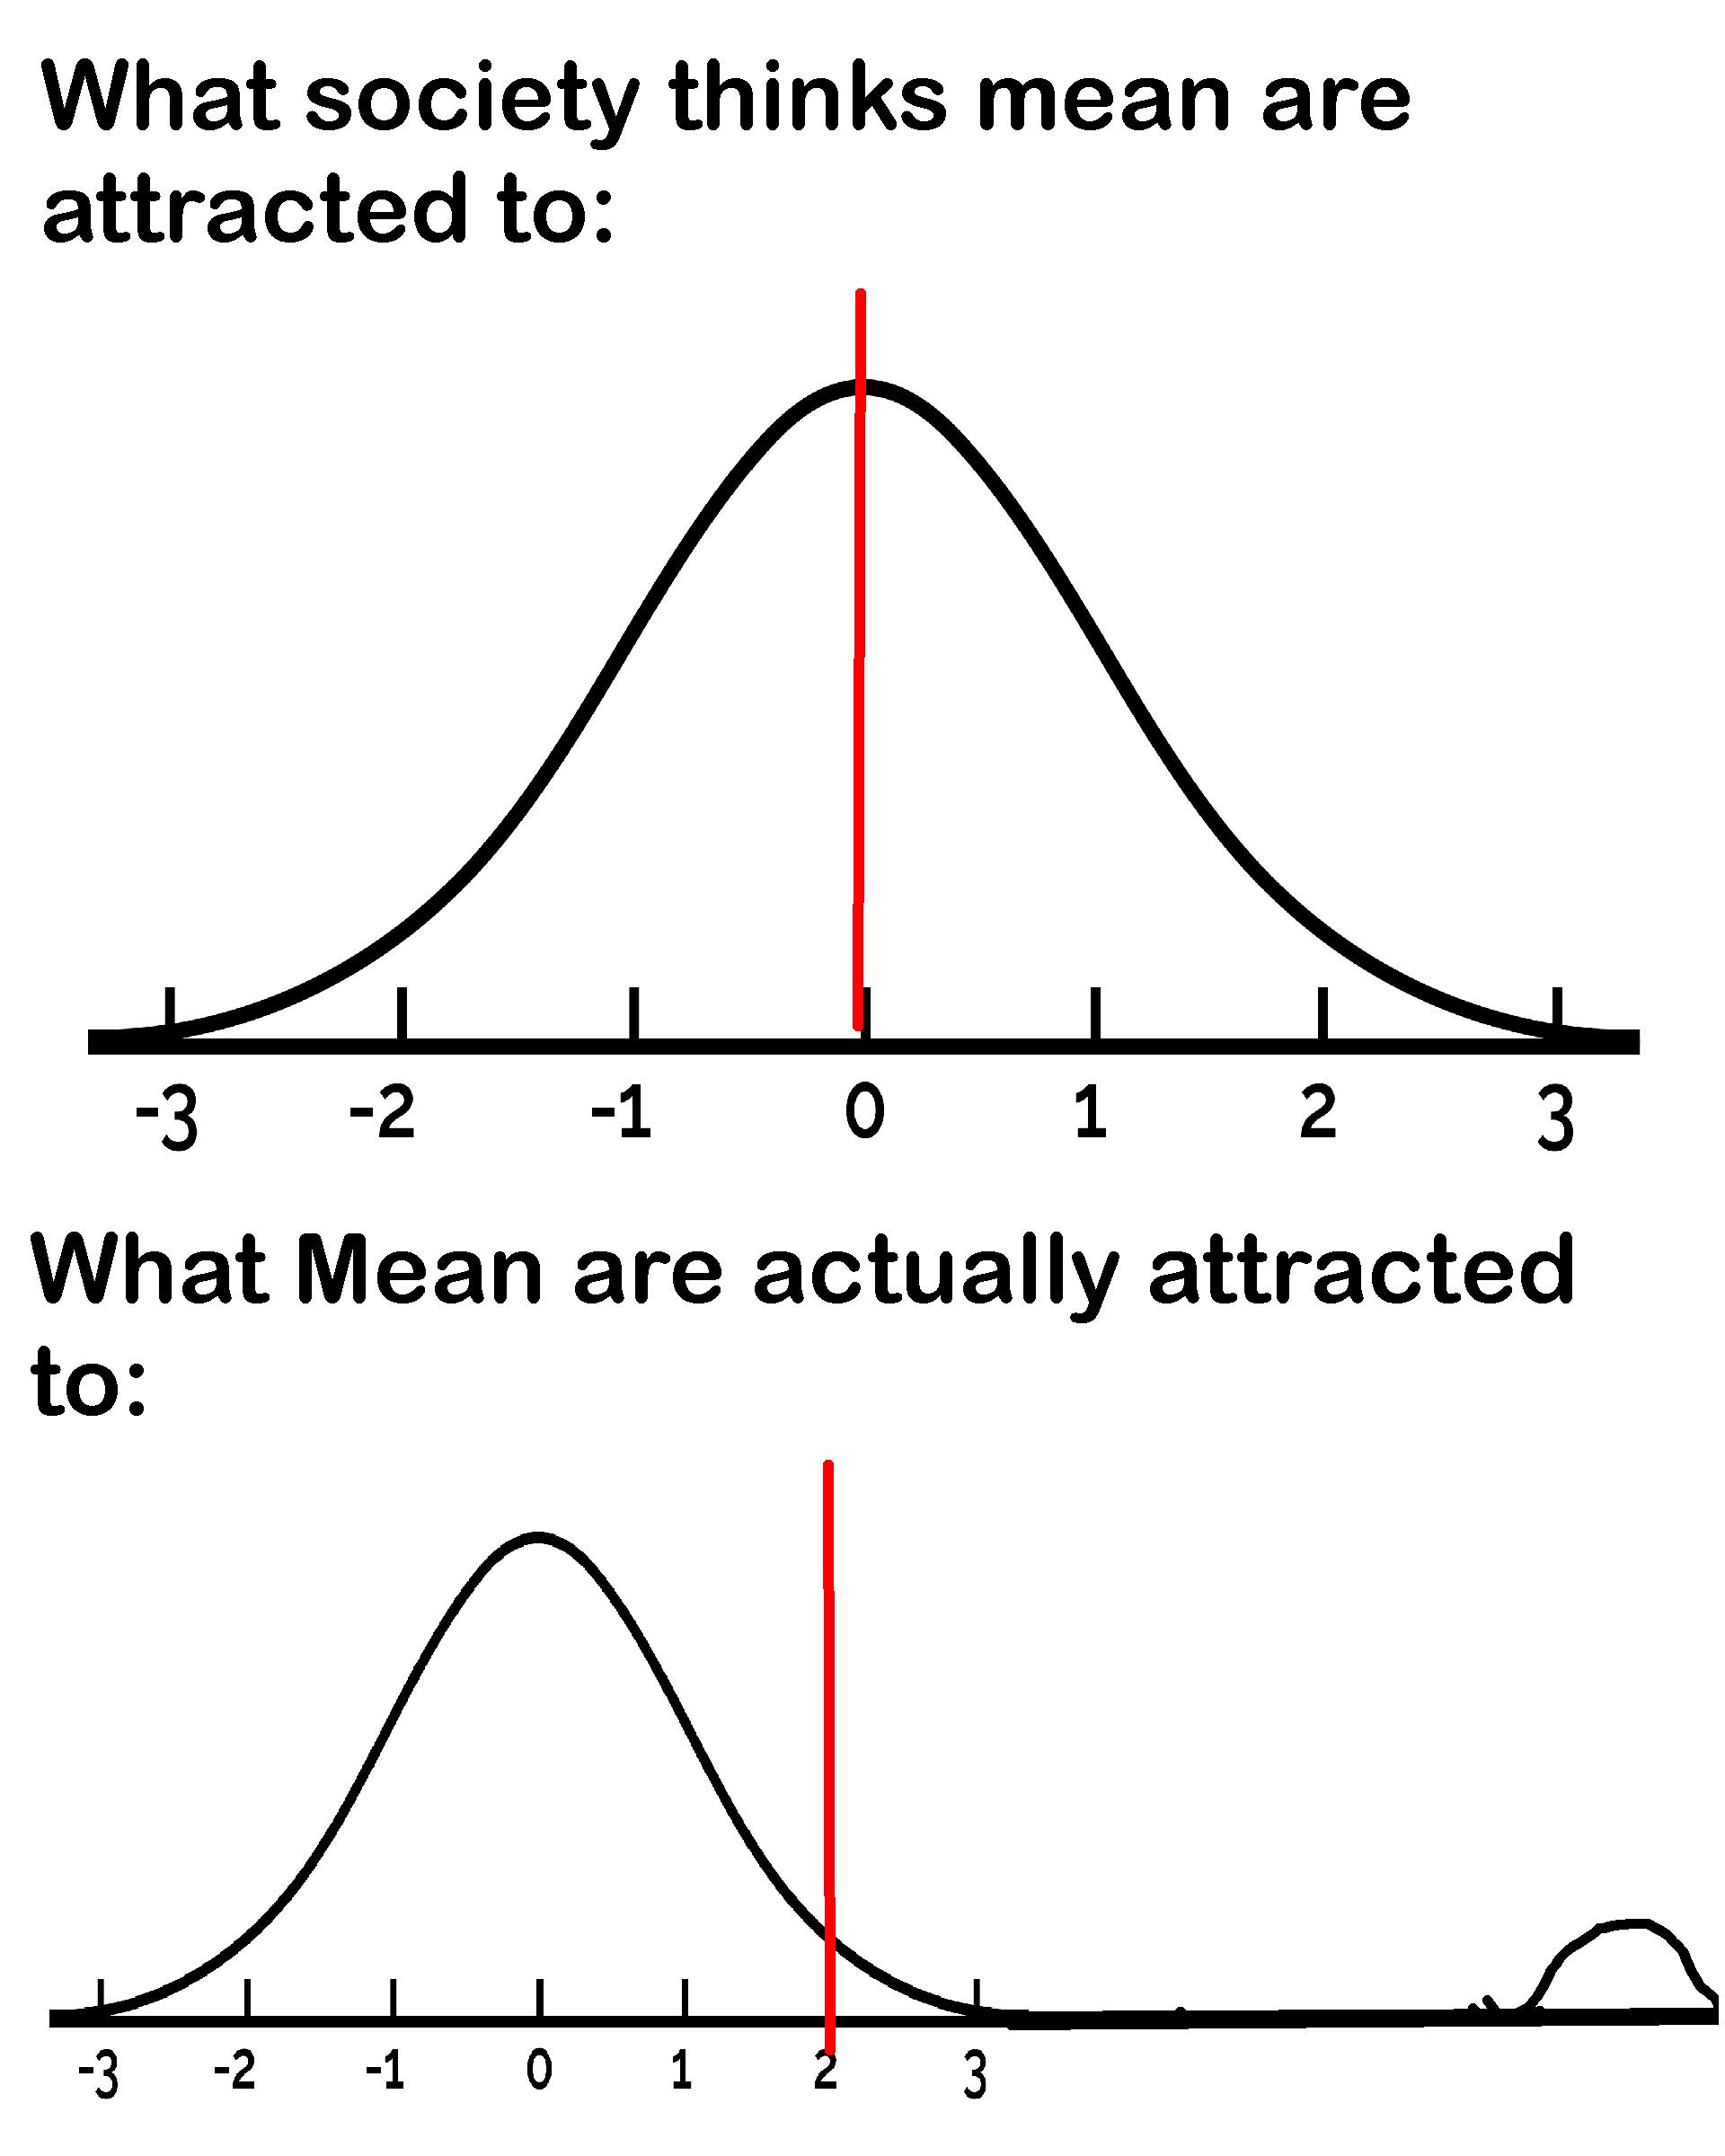
Oh, the glorious statistical wordplay! The top graph shows a perfect bell curve (normal distribution) centered at zero—what society thinks "mean" (average) people are attracted to. But add that little "a" and BOOM! The bottom graph shows what "mean" people actually prefer: a bimodal distribution skewed toward negative values with a tiny bump in the positive region! It's basically saying jerks prefer other jerks or occasional saints, completely rejecting the middle ground. Statistical humor that makes mathematicians snort coffee through their noses!
One Letter Changes Everything: The Math Of Meanness
statistics-memes, math-memes, wordplay-memes, bell-curve-memes, normal-distribution-memes | ScienceHumor.io
More Like This