

Spectroscopy Memes

Posts tagged with Spectroscopy
So-B Ased

So-B Ased
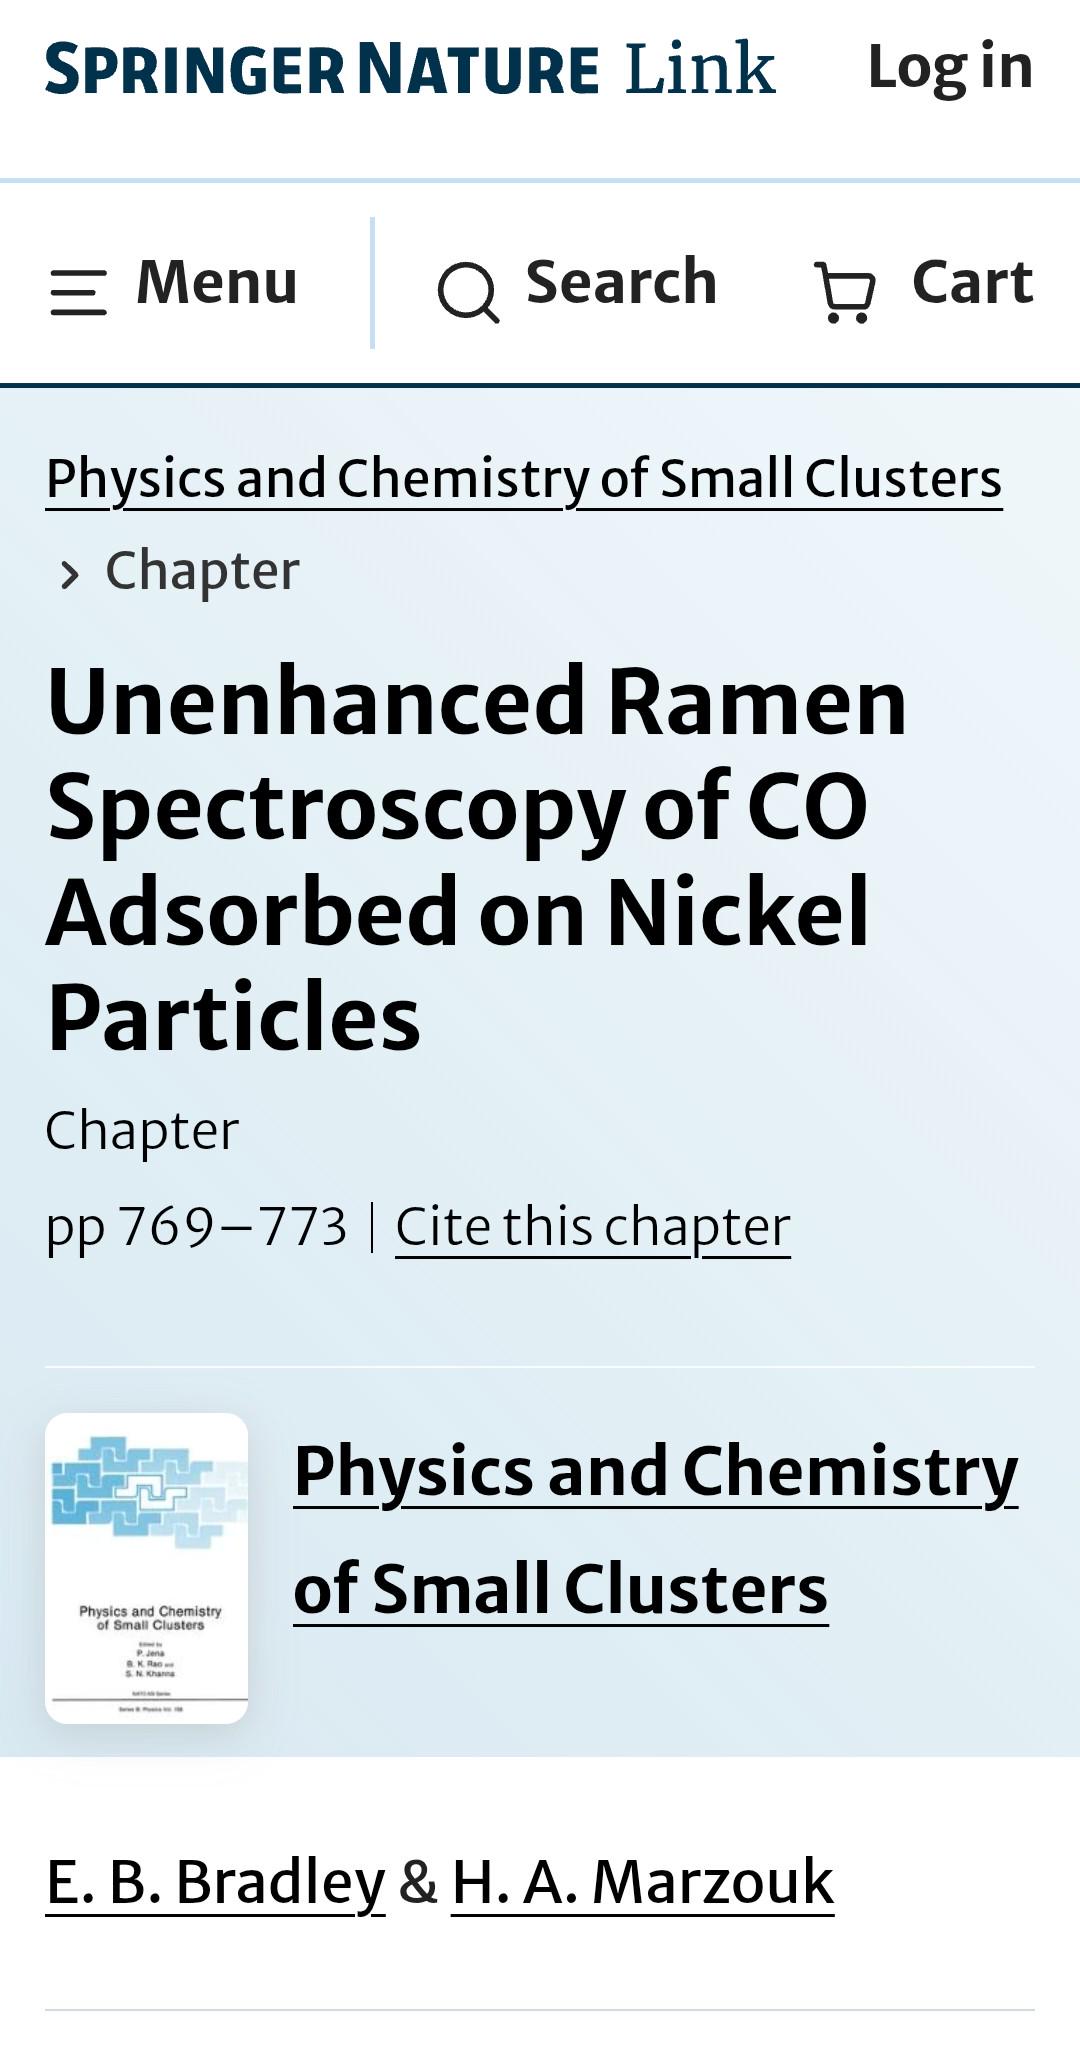
When you're studying CO (carbon monoxide) adsorbed on nickel particles and the paper title literally becomes a chemistry pun. "CO Adsorbed" = "CO-Adsorbed" which sounds exactly like "So based" in internet slang. The researchers knew EXACTLY what they were doing when they titled this chapter. Someone at Springer Nature really said "let's make surface chemistry cool" and honestly? Mission accomplished. The fact that this is real academic literature from a book called "Physics and Chemistry of Small Clusters" makes it even better. Bradley and Marzouk out here accidentally creating the most chemistry-bro title in spectroscopy history. It's giving "we're studying molecular interactions but make it Gen Z."

Spectrum

Spectrum
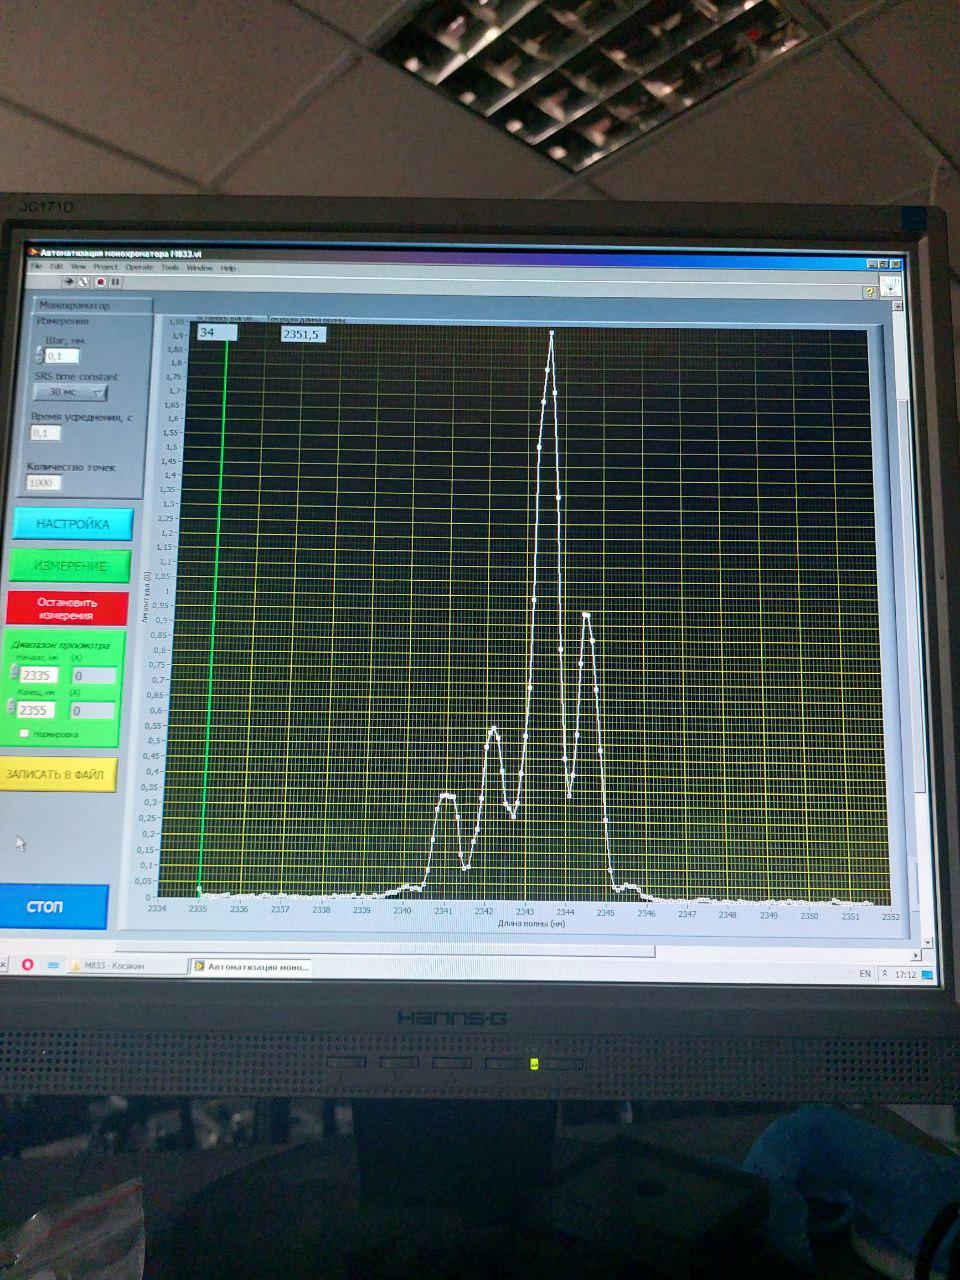
When your spectrometer data looks like a perfectly tuned middle finger pointing straight at your hypothesis, you know the universe has a sense of humor. That sharp peak around 2340 nm with those smaller satellite peaks? Nature just gave you the most eloquent "nope" in spectroscopic form. Scientists spend years perfecting their instruments, calibrating their equipment, and carefully designing experiments... only to have their data flip them off with stunning precision. The best part? You still have to write this up in your lab report with a straight face, probably calling it "an unexpected spectral feature" or "anomalous peak morphology." Meanwhile, everyone in the lab knows exactly what that spectrum is really saying about your expected results.

Happy Pride, Enjoy This UV-Vis Of A Molecule I'm Working With And Recorded Myself

Happy Pride, Enjoy This UV-Vis Of A Molecule I'm Working With And Recorded Myself
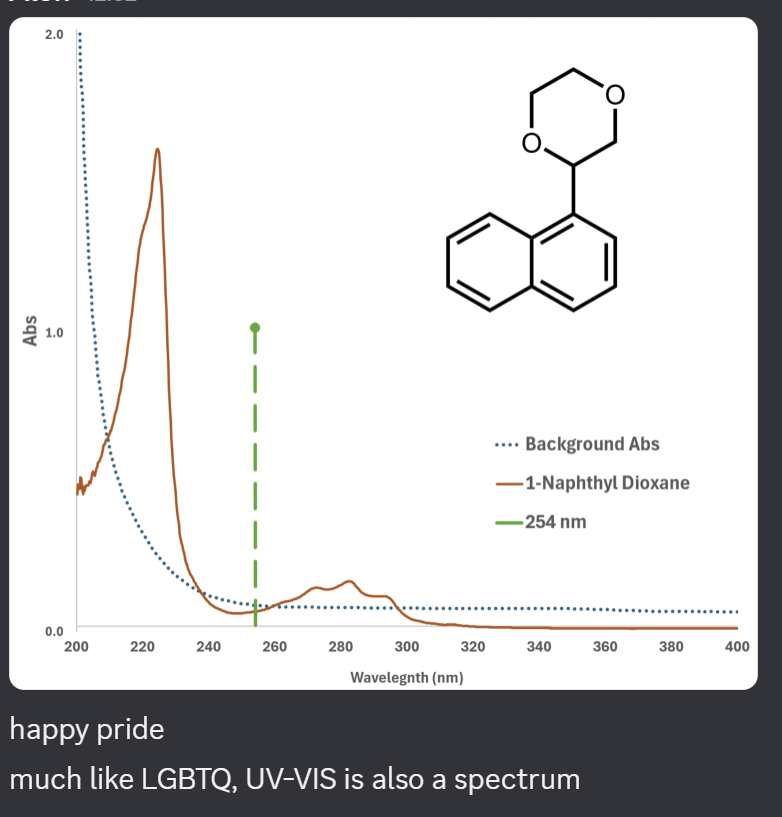
Someone in the lab just discovered their molecule is literally showing Pride colors through UV-Vis spectroscopy. The spectrum peaks at 254 nm—right in the UV range—which happens to be where many aromatic compounds absorb. But here's the genius part: they're celebrating that UV-VIS itself is a spectrum, just like the Pride flag represents a spectrum of identities. The compound (1-Naphthyl Dioxane, for those keeping track at home) is just vibing with its conjugated aromatic system, absorbing light like it's nobody's business. The researcher saw that beautiful absorption curve and thought "you know what? This is my Pride contribution." Nothing says inclusive science like finding rainbows in your analytical data. Chemistry really said "we support all spectra in this lab."

Thank You Overlapping Multiplet Signals

Thank You Overlapping Multiplet Signals
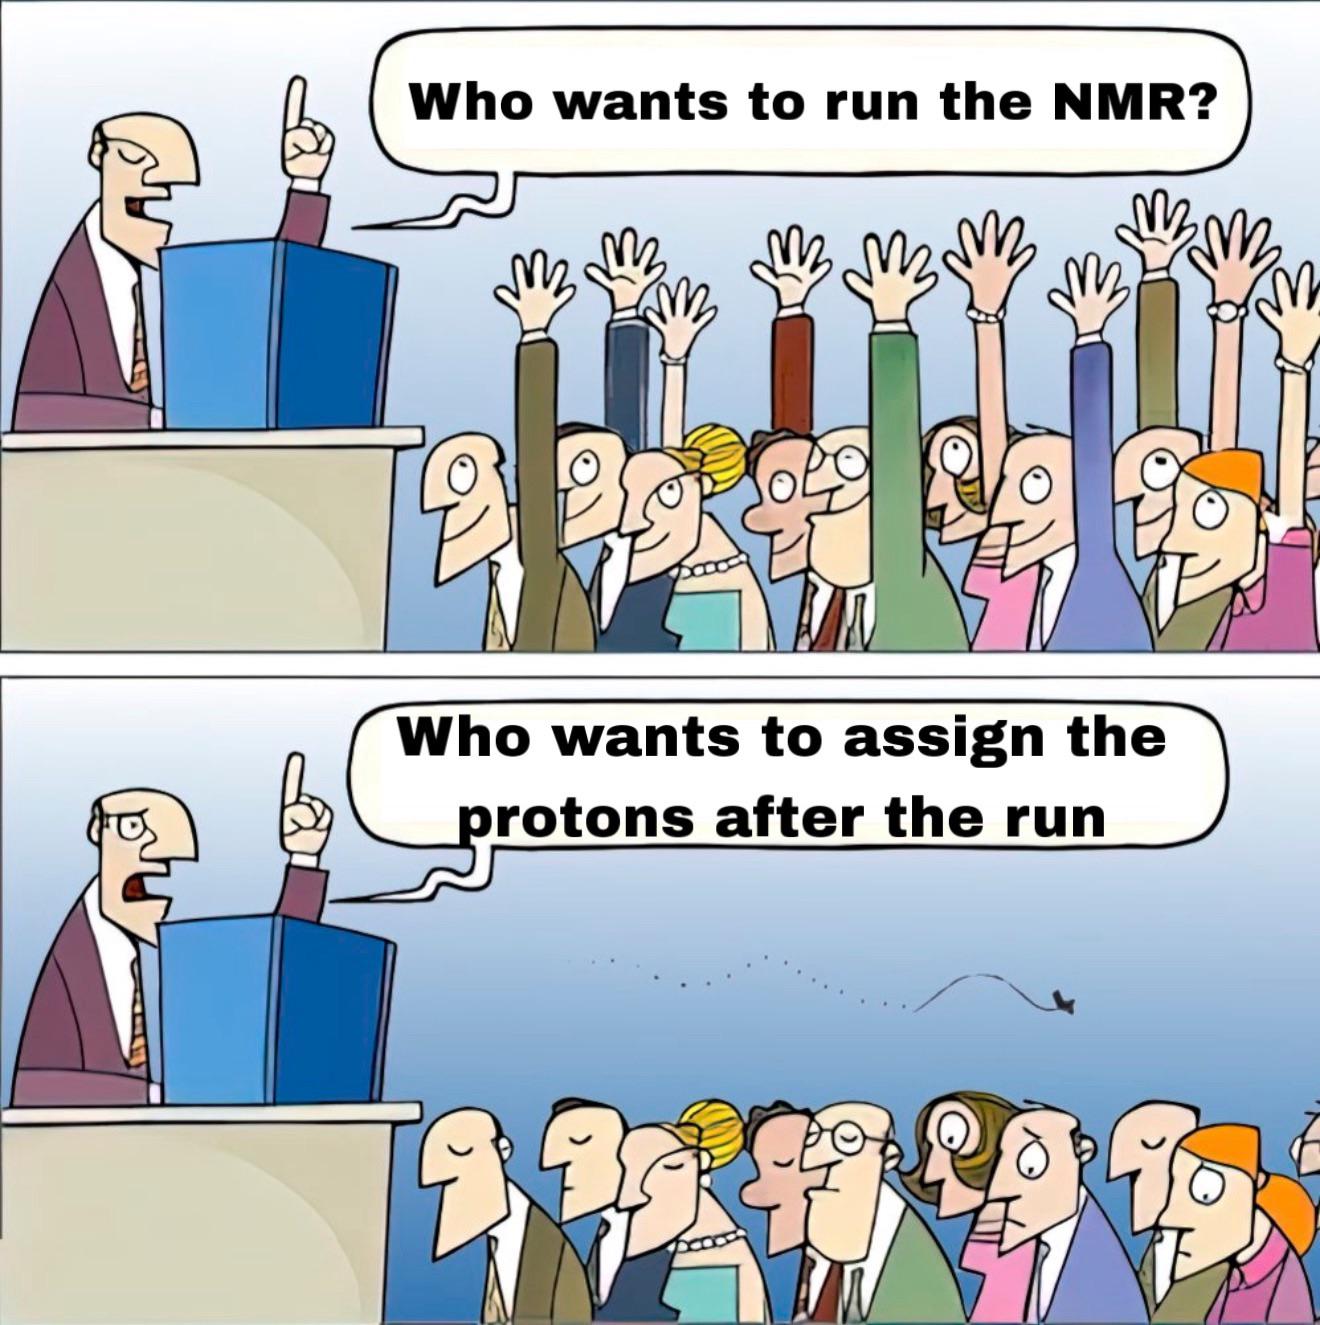
Running the NMR spectrometer? Sure, everyone's eager! Push a button, get pretty peaks, feel like a wizard. But then comes the soul-crushing part: assigning those protons when your multiplets decided to have a family reunion and all overlap into one chaotic blob. Suddenly, you're playing "guess which hydrogen is which" in a spectrum that looks like abstract art. NMR spectroscopy uses magnetic fields to identify hydrogen atoms (protons) in molecules. When neighboring protons interact, they create splitting patterns called multiplets. But when your molecule is complex enough, these signals overlap into an uninterpretable mess—turning what should be straightforward structural analysis into a cryptographic nightmare that makes you question your career choices. Every organic chemist has spent hours staring at overlapping multiplets at 3.5 ppm, wondering if they should just switch to computational chemistry where molecules stay in their lane.

Analytical Techniques Tier List

Analytical Techniques Tier List
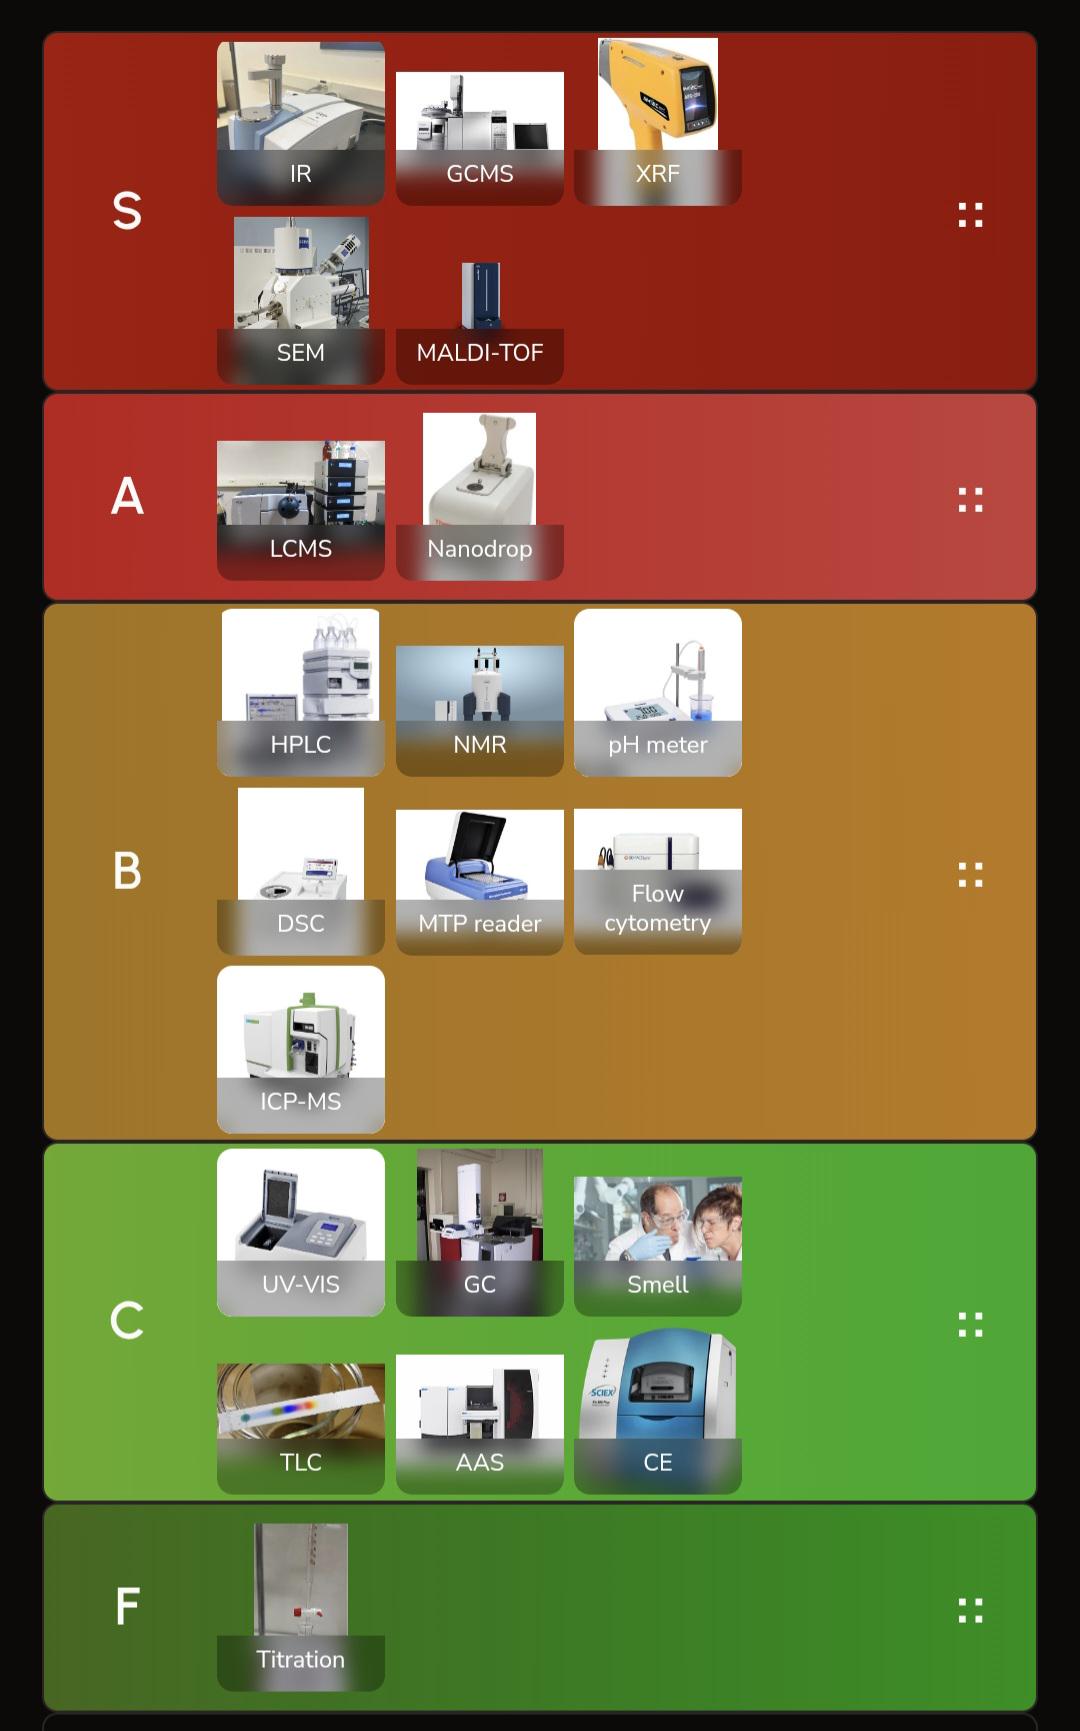
S-tier is reserved for the absolute workhorses of analytical chemistry—IR, GCMS, XRF, SEM, and MALDI-TOF. These are the instruments that make you look like a genius when they actually work, and cost more than a small house when they break. Then we've got A-tier with LCMS and Nanodrop, which are still incredibly powerful but somehow slightly less glamorous. B-tier features the reliable middle children: HPLC, NMR (which honestly deserves higher but probably got downgraded for making chemists wait 3 hours for a spectrum), pH meter, DSC, MTP reader, flow cytometry, and ICP-MS. C-tier is where things get spicy—UV-VIS, GC, and literally just "Smell" as an analytical technique (which, let's be real, organic chemists rely on way too much). Also TLC, AAS, and CE are here, probably because they're effective but nobody's writing home about them. F-tier? Just titration. Sitting alone in analytical chemistry jail. The disrespect is palpable, considering titration is what got most of us through freshman chemistry. But compared to shooting lasers at samples or ionizing molecules, yeah, manually dripping liquid from a burette does feel a bit medieval.

Guys, How Do I Tell This To My Bf?

Guys, How Do I Tell This To My Bf?
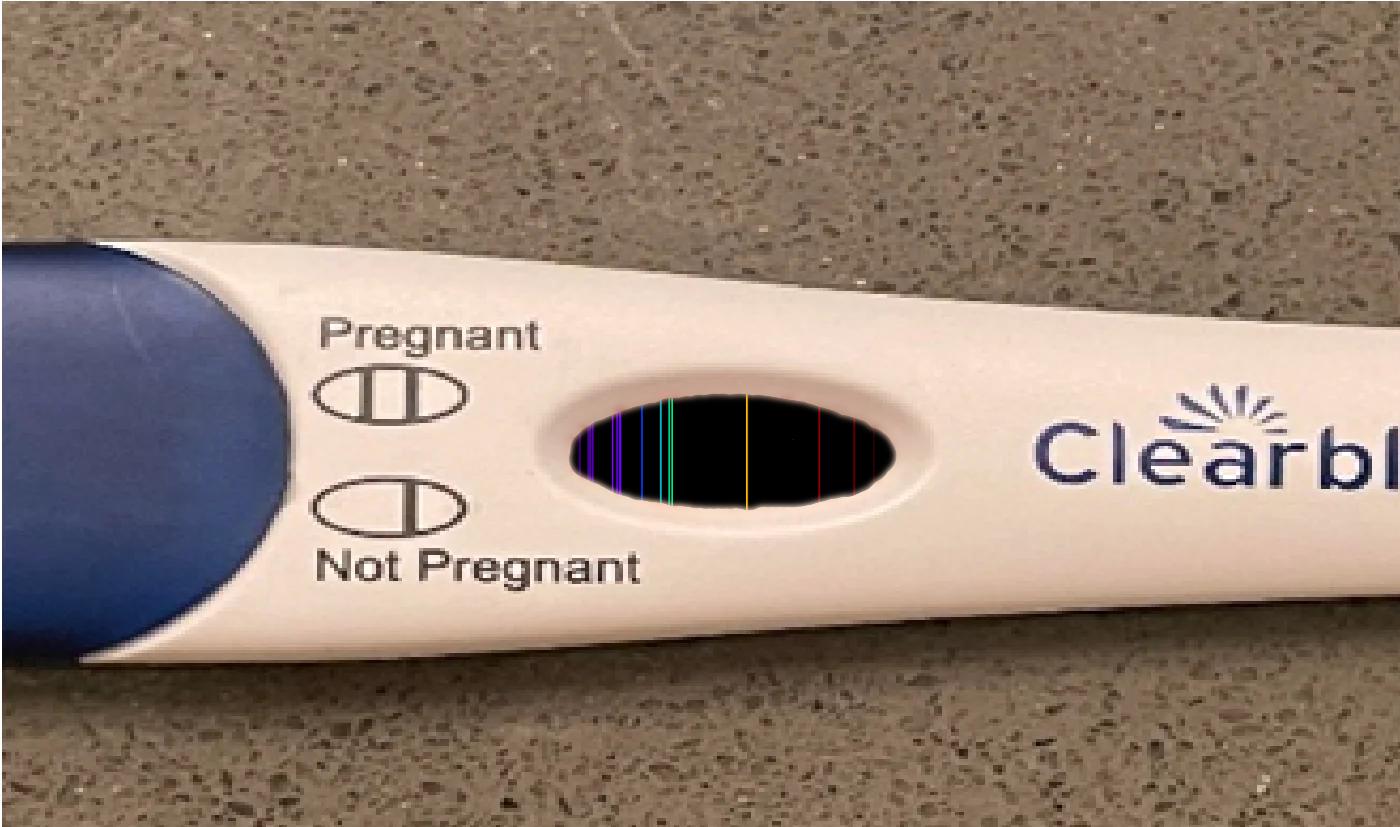
So apparently someone's pregnancy test just revealed the entire electromagnetic spectrum instead of a simple yes or no. That result window is showing a full spectroscopic readout with all those colorful vertical lines—like the test didn't just detect hCG hormones, it detected an entire rainbow baby. Literally. This is what happens when you accidentally use a spectrometer instead of a pregnancy test. The baby isn't just coming—it's coming with full wavelength data from ultraviolet to infrared. Congratulations, you're not just pregnant, you're pregnant with all frequencies of light simultaneously . The boyfriend is gonna need more than "we need to talk" for this one. Maybe start with "honey, our child is either a star or a diffraction grating." Fun fact: Those spectral lines are how scientists identify elements in distant stars. So either this test is broken, or you're about to give birth to a sentient nebula. Either way, stock up on diapers AND a telescope.

When A Spectroscopist Gets A Grant

When A Spectroscopist Gets A Grant
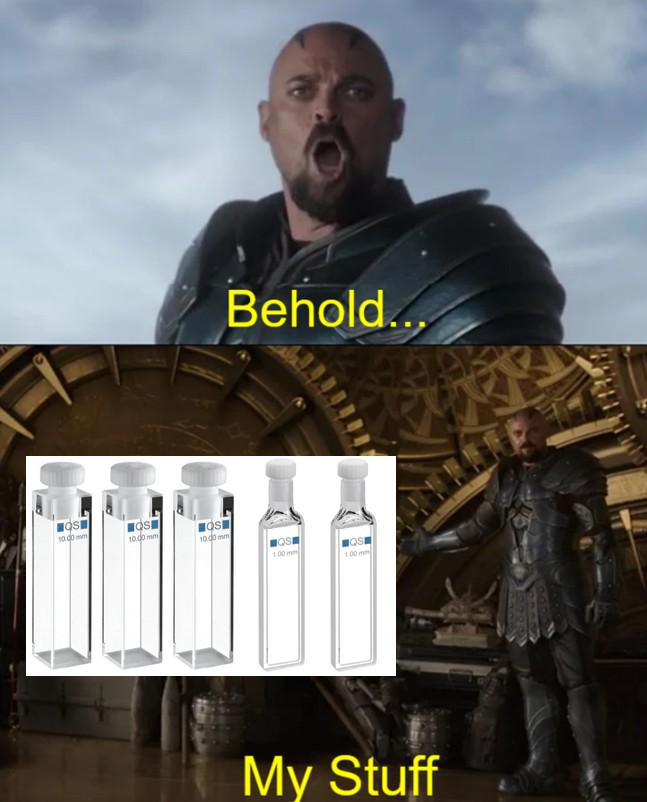
You know you've made it in spectroscopy when your entire grant budget goes toward acquiring an absolutely majestic collection of cuvettes. Nothing says "I'm living my best lab life" quite like having enough quartz cuvettes to fill a throne room. For the uninitiated: spectroscopists use these fancy little square cells (cuvettes) to hold samples while shooting light through them to analyze what's in there. The good ones—especially quartz cuvettes for UV work—cost more per milliliter than some people's rent. So when funding finally comes through, it's straight to the cuvette catalog like a kid in a candy store. Five brand new 10.00 mm path length cuvettes? That's not equipment, that's a treasure hoard . Meanwhile, the rest of the lab is still using that one cracked cuvette from 1987 that someone keeps "forgetting" to throw away.

The Spectroscopy After Dark

The Spectroscopy After Dark
The chemistry nerd's night out takes an unexpected turn! That moment when your recreational activities trigger an impromptu spectroscopy experiment. Sodium emission spectra feature distinct bright yellow lines at 589 nm wavelengths—exactly what you don't want to hallucinate while trying to party. Nothing says "I should have stayed in the lab" quite like involuntarily analyzing atomic electron transitions while everyone else is just vibing to the music. Chemistry degrees: ruining perfectly good recreational activities since forever.

Elements Of Surprise: When Fireworks Go Nuclear

Elements Of Surprise: When Fireworks Go Nuclear
The chemistry is spot on until... BOOM! That escalated quickly! The meme shows how different elements create beautiful colored fireworks—copper (blue), sodium (yellow), barium (green), magnesium (white), and strontium (red). But then there's uranium, casually producing a nuclear explosion instead of a cute little sparkle. Classic chemistry humor where one of these things is definitely not like the others. The difference between "ooh pretty lights" and "congratulations, you've vaporized the entire county."

The Spectral Analysis Rollercoaster

The Spectral Analysis Rollercoaster
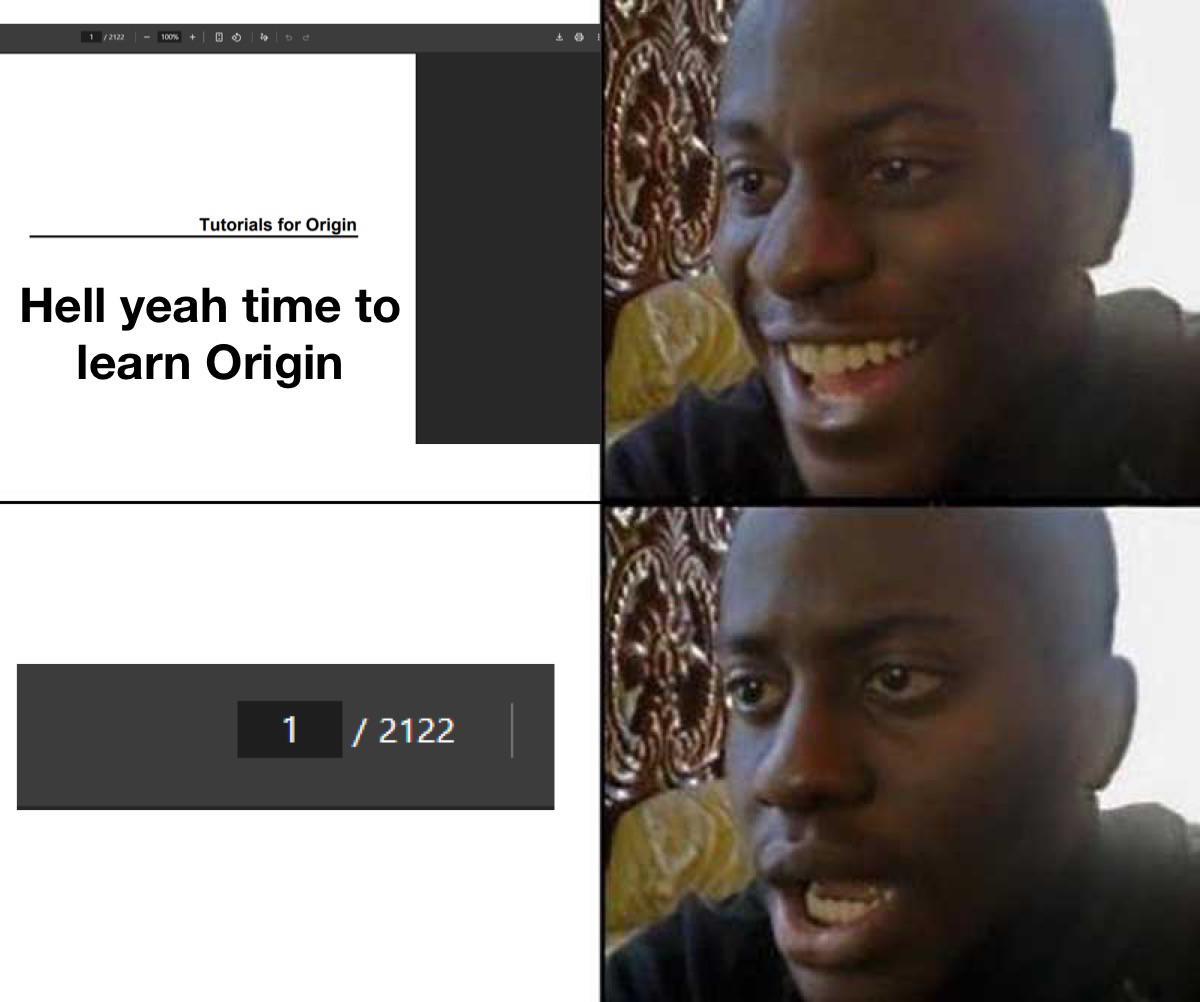
The initial excitement of discovering Origin software for spectral analysis quickly evaporates when reality hits! That moment when you realize you've got 2,122 Raman spectra peaks to fit and your weekend is officially GONE. First frame: "Ooh, fancy new software to analyze my data!" Second frame: "WAIT—I have to manually fit HOW MANY peaks?!" It's like showing up for a chemistry party and discovering you're actually the entertainment. The multiple peak fitting in spectroscopy is the scientific equivalent of trying to untangle Christmas lights while wearing oven mitts. Pure madness in data form!

Elemental Pride: Atomic Emission Spectra

Elemental Pride: Atomic Emission Spectra
The "rainbow flag" joke is actually showing atomic emission spectra, which are the unique light patterns elements emit when excited by energy. Each element has a distinctive spectral fingerprint - like atomic barcodes. Hydrogen's simple pattern versus Mercury's complex lines reveals how electron configurations create these signatures. The conspiracy theory reference is just a nerdy bait-and-switch to show you some fundamental spectroscopy. Chemists are rolling their eyes while secretly appreciating this peak element humor.

These Spectra Look Mighty Similar

These Spectra Look Mighty Similar
Spectroscopy nerds unite! The top shows IR absorption where a molecule gets whacked with a rake (photon) and absorbs that energy. The bottom shows skateboarders demonstrating Stokes Raman scattering—where light hits a molecule, gets scattered, and loses some energy in the process. Both techniques measure vibrational energy levels, just through different mechanisms. It's like ordering pizza vs. making pasta—different processes, same result: you still end up with delicious food... I mean, valuable molecular data! The equations (ΔE = hν₀) show energy conservation at work. Next time you step on a rake or wipe out skateboarding, just tell everyone you're demonstrating advanced spectroscopy principles!