

Research methods Memes

Posts tagged with Research methods
"Fail To Reject The Null" Are You Kidding Me

"Fail To Reject The Null" Are You Kidding Me
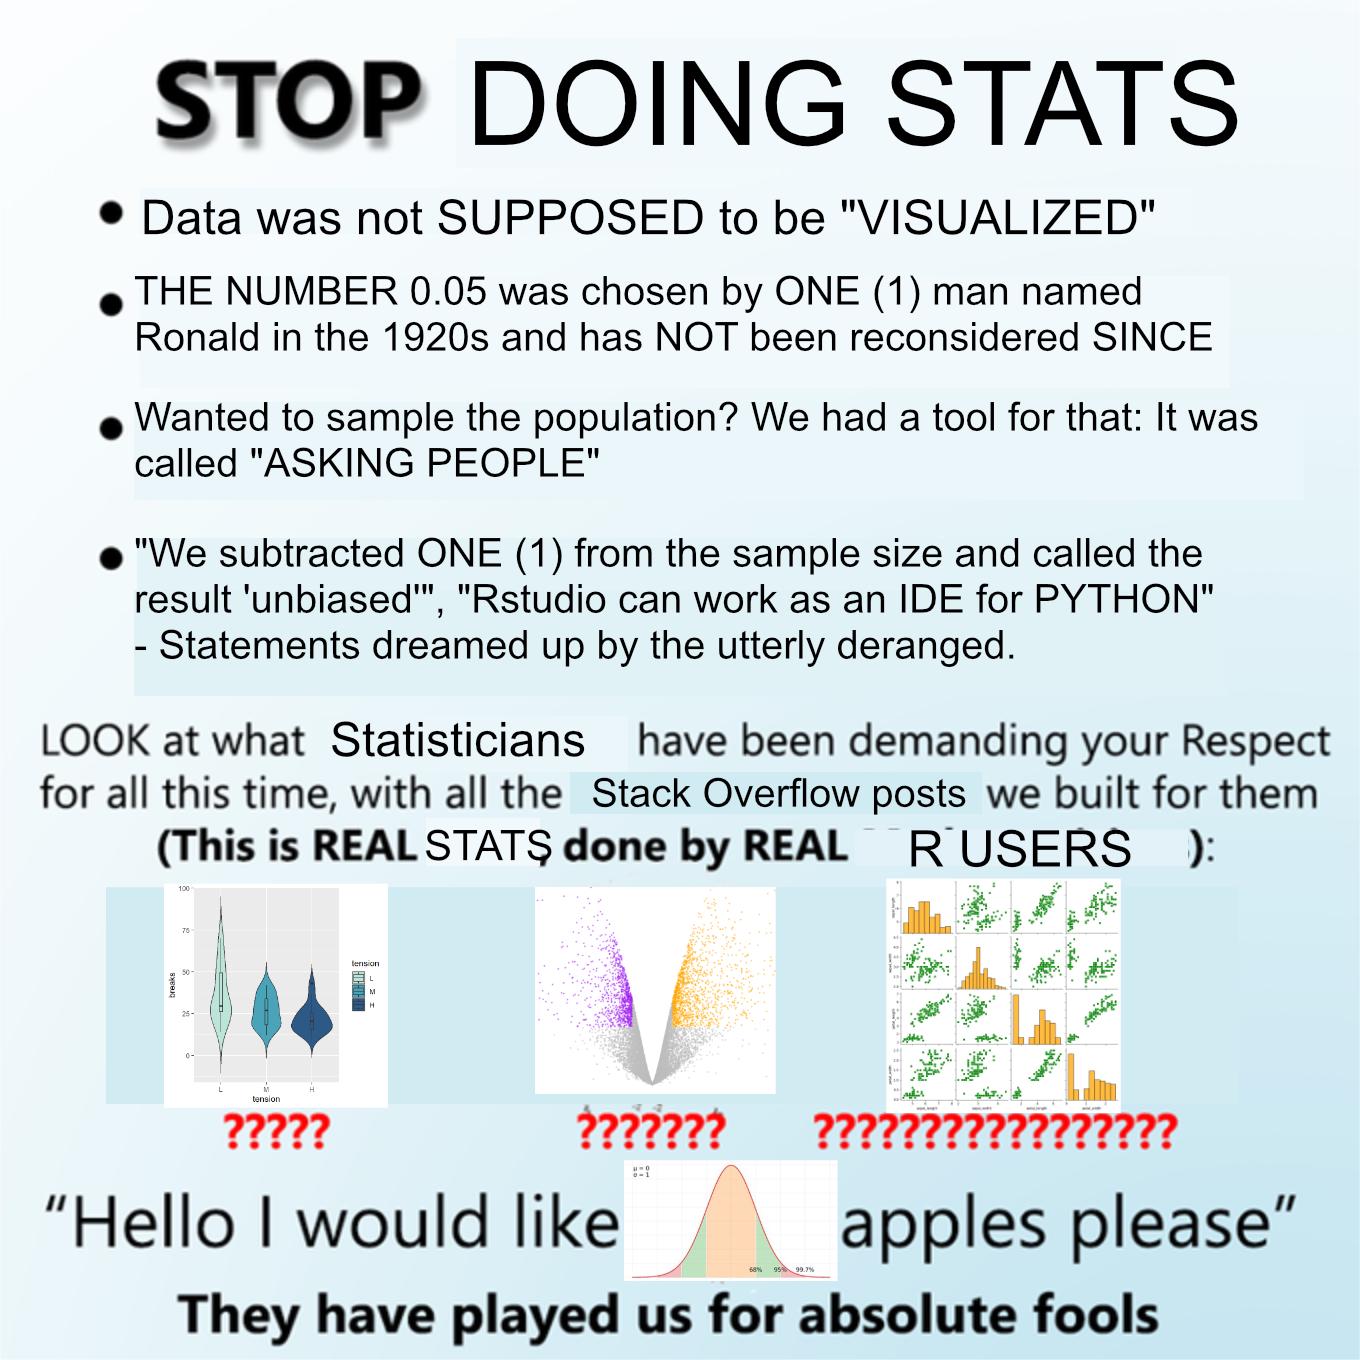
This is the statistician's version of a public roast, and honestly, they deserve it. The meme calls out every frustration non-statisticians have with stats culture: the arbitrary p=0.05 threshold (thanks Ronald Fisher from the 1920s for that legacy), the overcomplicated jargon like "fail to reject the null hypothesis" instead of just saying "no significant difference found," and the obsession with making beautiful visualizations that confuse more than clarify. The real kicker is the bottom section showing what "real R users" actually create—violin plots that look like abstract art, scatter plots that resemble butterfly wings, and correlation matrices so dense they need their own ZIP code. The confused question marks underneath each graph perfectly capture everyone's reaction when statisticians present their "findings." And that final punchline? "Hello I would like apples please" with a simple normal distribution curve. Translation: sometimes people just want straightforward answers, not a PhD thesis on why your methodology is theoretically sound but practically incomprehensible. The statisticians have indeed played us for absolute fools with their fancy graphs and arcane terminology.

Exoplanets Meme

Exoplanets Meme
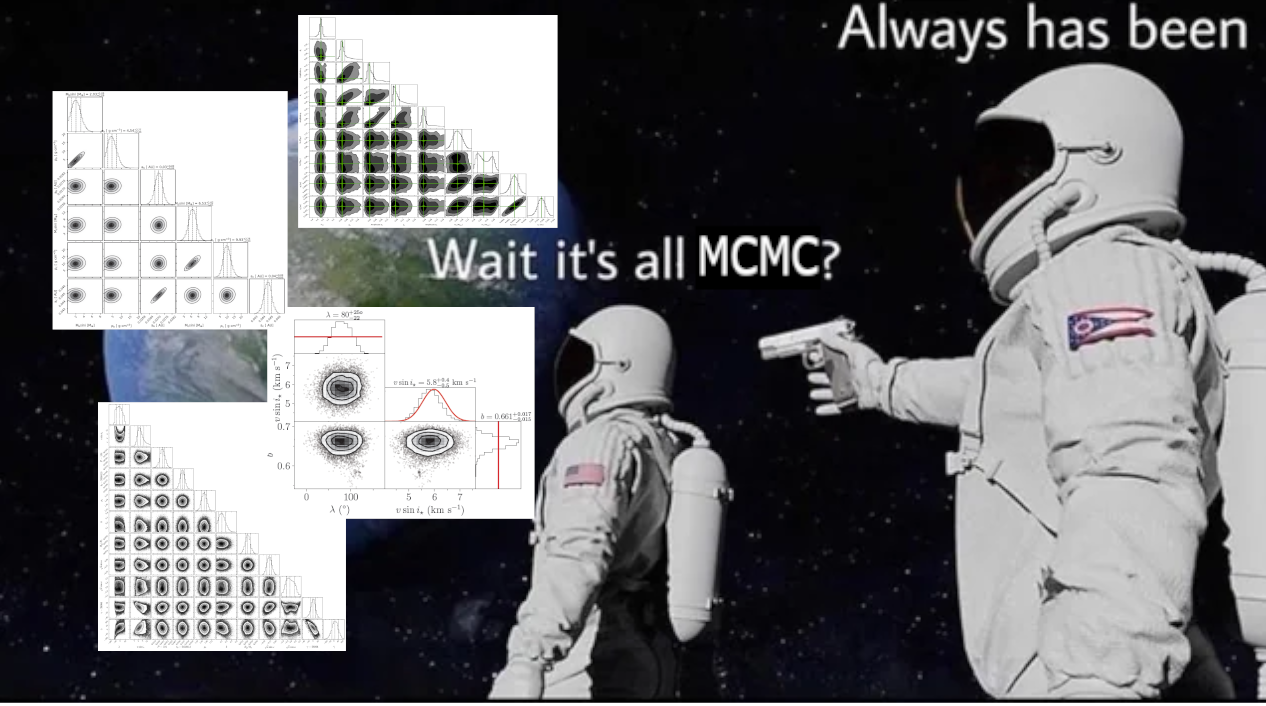
So you've been painstakingly collecting exoplanet data, running sophisticated detection algorithms, analyzing light curves, and generating beautiful statistical distributions. You're feeling pretty good about your diverse catalog of planetary discoveries—different sizes, different orbits, different characteristics. Science is happening! Then reality hits: they're basically all detected using MCMC (Markov Chain Monte Carlo) methods. Your "diverse" dataset is really just the same statistical hammer hitting different nails. The astronaut's existential crisis is justified—when your entire field relies on one computational method to validate discoveries, are you really exploring the cosmos or just exploring parameter space? MCMC is the bread and butter of exoplanet detection because it's brilliant at exploring probability distributions when you have noisy data and complex models. But it also means every discovery comes with those characteristic contour plots and corner plots that all look suspiciously similar. It's like realizing every restaurant in town uses the same recipe book.

Saw This In Explain The Joke...

Saw This In Explain The Joke...
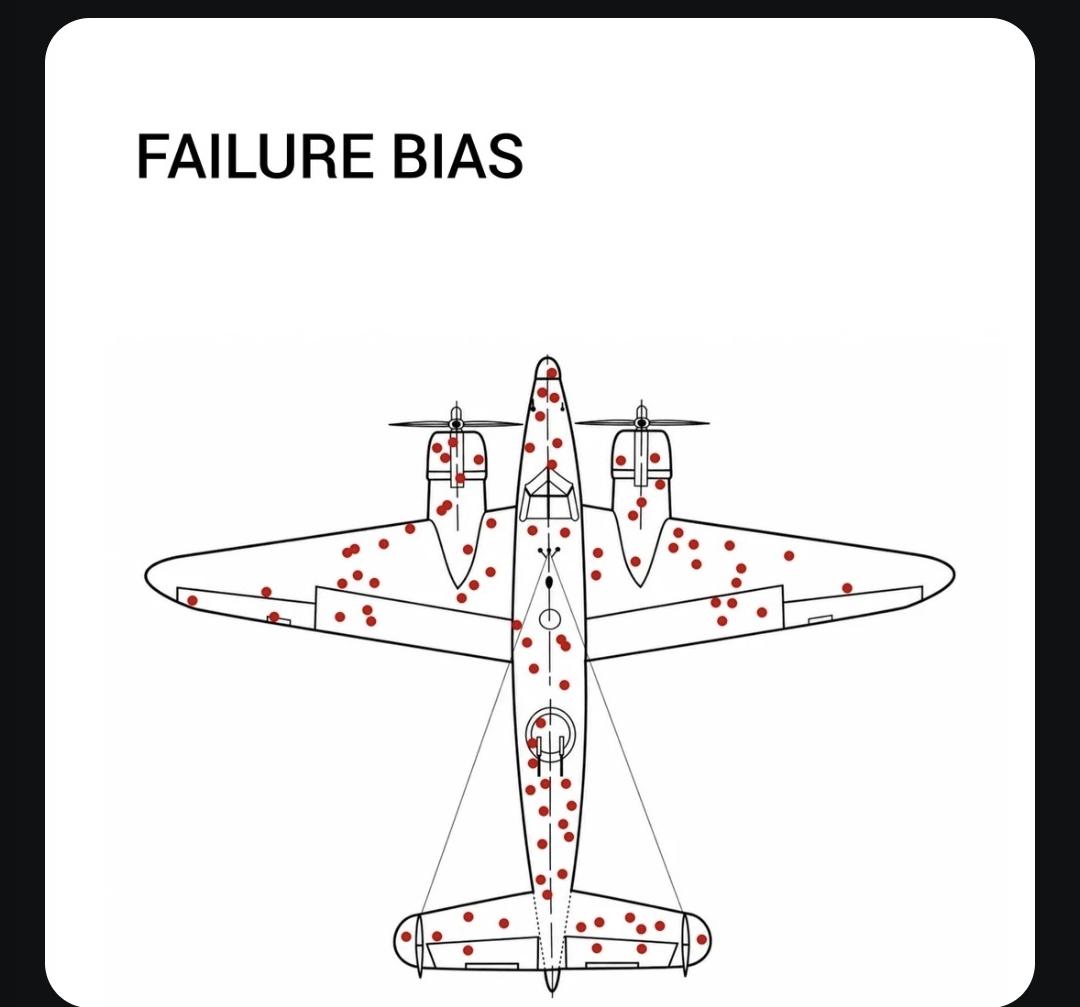
Survivorship bias is that sneaky psychological trap where we only look at what made it through and completely ignore everything that didn't. During WWII, statistician Abraham Wald noticed the military wanted to reinforce bomber planes where they saw bullet holes on returning aircraft. But here's the galaxy brain move: those planes SURVIVED. The bullet holes you're NOT seeing? Those are in the engines and cockpit—the spots that actually brought planes down. The dots on this plane represent damage from survivors, while the empty spaces are the real danger zones. It's like interviewing only lottery winners about investment strategies and wondering why your portfolio is crying. We do this constantly in research—studying successful businesses while ignoring thousands of bankruptcies, or analyzing centenarians who smoked daily while missing the millions who didn't make it. Your brain is basically a highlights reel that forgot to include the bloopers, and that's how you end up armoring the wrong parts of your metaphorical airplane.

Finding Out How We Know That Our Body Is Made Of 70% Water

Finding Out How We Know That Our Body Is Made Of 70% Water
So you're telling me some scientist just... squeezed people until they figured out the water percentage? Because that's exactly the vibe this guy's face is giving off. That "wait, WHAT did they do to discover this?" realization hitting hard at 2 AM. Plot twist: they actually used methods like bioelectrical impedance analysis and isotope dilution techniques, but imagining some Renaissance dude just wringing out volunteers like wet towels is infinitely funnier. The sheer horror of realizing how much trial and error went into basic human biology facts we casually drop at parties is *chef's kiss*. Fun fact: the percentage varies wildly depending on age, body composition, and hydration levels. Babies are basically water balloons at 75%, while elderly folks drop to around 50%. You're literally drying out as you age. Sweet dreams!

I Hate Statistics (But Use It Every Day)

I Hate Statistics (But Use It Every Day)
The eternal struggle of statistics students everywhere! On the left, we see the dramatic illustration of someone being crushed by the "abstract gibberish with no real-world application" - which is EXACTLY how your brain feels during a stats exam! Meanwhile, on the right, the pure despair of a child trying to understand why we need to calculate standard deviations when spreadsheets exist! The hilarious irony? Statistics is literally EVERYWHERE in real life - from vaccine trials to Netflix recommendations - yet somehow manages to feel like an ancient mystical language designed specifically to torture students! No wonder we're all chanting "I hate statistics" while simultaneously using it to decide if that extra cookie is statistically significant to our diet! 😂

I Don't Think I'll Confuse Type I And II Errors Again After This

I Don't Think I'll Confuse Type I And II Errors Again After This
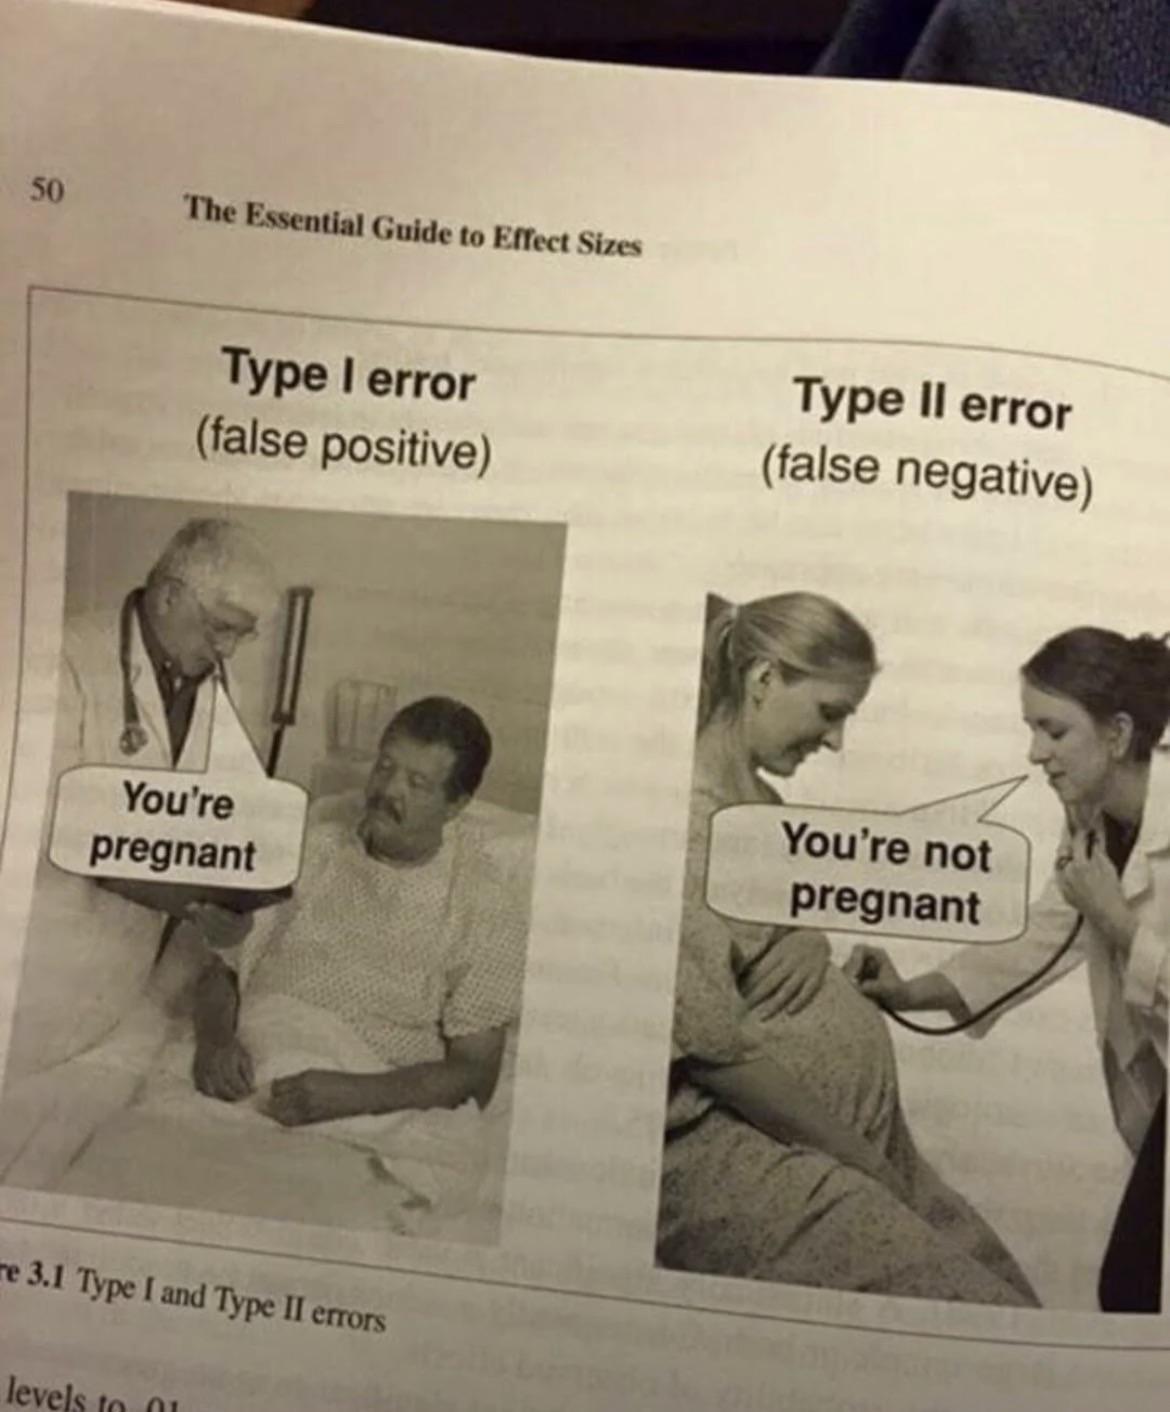
Statistical concepts have never been so... reproductive ! This textbook example brilliantly demonstrates Type I and Type II errors using pregnancy diagnoses. A Type I error (false positive) shows a doctor telling a clearly male patient he's pregnant—rejecting a true null hypothesis when it's actually true. Meanwhile, the Type II error (false negative) shows a doctor telling a visibly pregnant woman she's not pregnant—failing to reject a false null hypothesis. Next time you're struggling with statistics homework, just remember: if your male friend gets a positive pregnancy test, you've got yourself a classic Type I error. The p-value is probably as confused as that poor man's face!

Sample Size Is Important

Sample Size Is Important
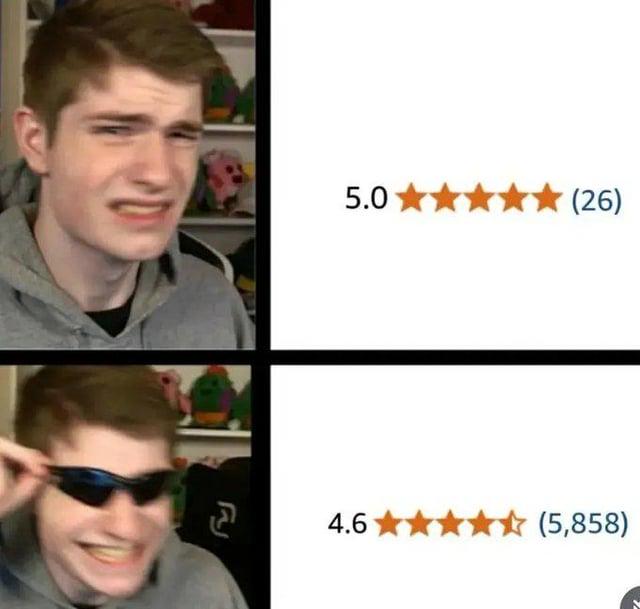
The statistical tragedy in one image! That smug face when someone realizes a 5.0 rating with 26 reviews is statistically meaningless compared to 4.6 with nearly 6,000 reviews. First-year stats students make this mistake until they get their first F for ignoring confidence intervals. The larger sample gives you actual reliability, while those 26 reviews could just be the creator's desperate friends. Trust the wisdom of thousands, not the enthusiasm of dozens.

When Your Sample Size Determines Your Scientific Credibility

When Your Sample Size Determines Your Scientific Credibility
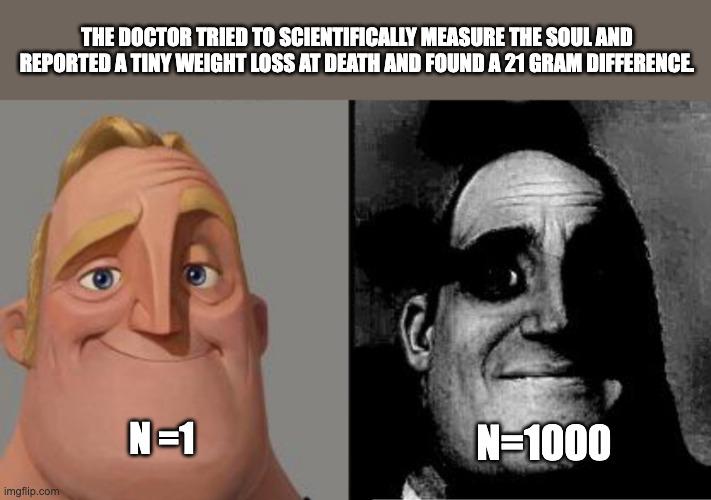
Ever heard of the infamous 21 grams experiment? In 1907, Dr. Duncan MacDougall weighed dying patients to prove souls have mass! His tiny sample size (N=1) led to a wild conclusion that became paranormal legend. Meanwhile, actual scientists are facepalming with their properly designed studies (N=1000). This meme brilliantly roasts how a single questionable data point spawned an entire supernatural belief system! The "soul weighs 21 grams" myth persists despite being based on methodology that would make any statistics professor cry themselves to sleep.

Just Draw A Line, People Won't Notice

Just Draw A Line, People Won't Notice
The eternal academic ritual: scatter plots with absolutely no correlation? No problem! Just slap a regression line on there and suddenly you've got a "trend." The comments nail it perfectly - random data points transform into publishable research the moment you force a blue line through the chaos. It's the scientific equivalent of putting lipstick on a pig, except the pig gets you tenure. The real crime against humanity isn't the forced correlation—it's that someone will cite this paper in their literature review without checking the R² value.

The Observer Effect: Immortal Cameramen And Statistical Ghosts

The Observer Effect: Immortal Cameramen And Statistical Ghosts
The perfect illustration of observation bias in scientific studies. On the left, we have the "cameraman never dies" trope from action movies—implying the observer is somehow immune to danger. On the right, survivorship bias in its purest form—we only see data from subjects who lived to tell the tale. The rest? Dead in a statistical ditch somewhere. Next time you read a groundbreaking paper, remember all the failed experiments that never made it to publication.

The Unfiltered Truth About Field Biology

The Unfiltered Truth About Field Biology
The reality of field biology is WILD! While everyone thinks biologists just walk around identifying species with fancy Latin names, actual biologists are out there designing chaotic experiments like "what if I replace eggs with rocks and fake a predator attack?" This is literally how we advance science—by messing with animals in slightly unhinged ways and seeing what happens! Field research is basically controlled chaos with clipboards. That poor robin is about to become an unwitting participant in someone's dissertation on stress responses in avian parents. Science isn't always gentle, but those data points aren't going to collect themselves!

Survivor Bias: The Statistical Loophole

Survivor Bias: The Statistical Loophole
The statistical masterpiece of survivor bias in its natural habitat! The comment claims Russian roulette is "completely safe" based on interviewing 1000 previous players with a 100% survival rate. Of course they all survived—you can't interview the losers! 💀 This is like concluding parachutes are unnecessary because no one has ever complained after jumping without one. Classic selection bias that would make any statistician cry into their probability distribution charts.